The first of this three-part series showed how systems engineering can be used to correctly diagnose and address the causes of delays in a clinic. This second article describes how to design a more productive system that meets the new and follow-up demand for a clinic.
Many ophthalmology teams are struggling to meet the demand for new and follow-up (FU) appointments. Some will have introduced ‘fast track’ or ‘urgent’ services in order to ‘rescue’ vulnerable patients from their queue. In doing so they may have unwittingly compromised their system so that ‘non-urgent’ patients (with known disease and who require monitoring) are increasingly unlikely to be seen on time. Not only are such systems extremely stressful for patients and staff, they can become clinically ineffective and unsafe.
How do we design clinical services that meet the new and follow-up demand on time?
Mapping the macro, meso and microsystems
An ophthalmology service is a macrosystem that is ‘divided up’ into mesosystems to serve specific clinical conditions that require specific technology and skills (e.g. cataracts, glaucoma, retina, anterior segment, etc.). Each mesosystem is then divided up into microsystems (clinics) where the specific resources are made available (e.g. rooms, specialist staff, equipment and consumables). The system design is further complicated because the same resources, may be required by several microsystems and so the resource time is shared out and scheduled between these microsystems.
Mapping the glaucoma mesosystem
The structure of the glaucoma mesosystem will be specific to each service. For example, a glaucoma service may have:
- One clinic to screen and sort patients referred by their community optometrist with raised intraocular pressure
- Another clinic to monitor those patients who have or are at risk of glaucoma
- A third type of clinic for patients whose intraocular pressures are not adequately controlled and require further review for other interventions by a consultant ophthalmologist, e.g. trabeculoplasty or trabeculectomy.
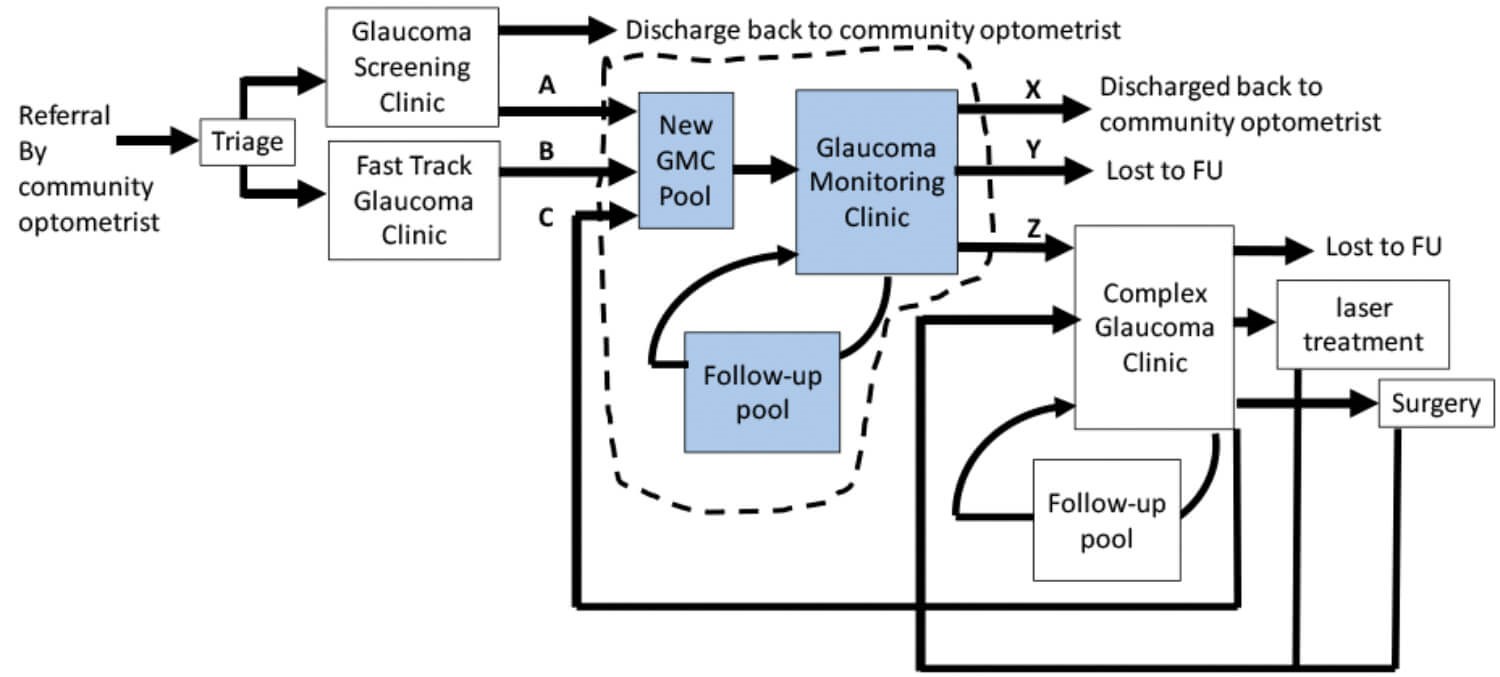
Figure 1 shows how a glaucoma mesosystem can become very complicated and more difficult to manage. Let us assume that the main issue for this service is that patients diagnosed with glaucoma are not getting their follow-up appointments in the Glaucoma Monitoring Clinic (GMC) on time. As a consequence, delays and waiting-list initiatives in the GMC are consuming the shared resource and the waiting times for the upstream Glaucoma Screening Clinic are increasing beyond the six-week target lead-time from referral. In response to complaints from the community optometrists, the service has further divided up their resources and created a triage step and a ‘fast-track’ clinic to ‘rescue’ those patients at high risk of glaucoma from the long waits for the GMC.
The clinical team (including their manager and data analyst) decide to ensure that all patients with glaucoma get their monitoring appointments on time. They start by understanding the flow through the GMC and, crucially, define its boundary and the patient flows across the boundary as shown by the dotted line in Figure 1.
Measuring the flow through the GMC microsystem
The flows into this mesosystem described in Figure 1 above are the referrals from:
A. Glaucoma Screening
B. Fast Track
C. Complex Glaucoma clinic.
The flow-out is made up of:
X. The patients who, after adequate follow-up, are discharged back to the community optometrist (including those who have gone blind)
Y. The patients who are lost to follow-up (LTF), e.g. patients who have died, moved away or don’t want to be seen again
Z. Referrals to the Complex Glaucoma clinic (CGC).
There are three stocks (or pools) inside the GMC sub-system:
- The ‘new’ patients (from A, B and C) waiting to come into the GMC
- The clinic itself which fills and empties within four hours each day the clinic runs
- The follow-up pool for the GMC: All the patients waiting for their subsequent monitoring appointments, including the patients that did not attend (DNA) and who need to be seen again.
NB. Though these definitions may not correlate with those used in the NHS (e.g. a patient returning from a complex clinic to the monitoring clinic may be classified as a follow-up), the complex patients have crossed the dotted-line boundary from one sub-system to another and back again. This convention is vital for the subsequent calculations of the new and follow-up FU demand.
Little’s law
In a system in which the average stock (queue, pool, work-in-progress, (WIP)) is stable over time, then what is flowing in, must be flowing out (λ). Little’s law [2] states that the average lead-time, i.e. the time from referral to being seen (T) is T=WIP/λ.
We want to know the number of New and FU appointments / week (λ) required to keep the New and FU stock at a level that delivers the required lead-times, i.e. maximum of six weeks for flows A and B and the clinically specified lead-times for patients returning from CGC (C) and the GMC FUs. Crucially, the New and FU stock levels must not increase.
First mindset change
The number of patients in the combined New and FU GMC follow-up pool cannot grow indefinitely. Eventually it will stabilise when the New patient flow into the pool (A, B and C) equals the flow out (X, Y and Z) (Figure 1).

Figure 1: Map of the glaucoma mesosystem and microsystems.
Measuring the flow through the GMC
These data can be collected manually or via the Patient Administration System (PAS). However, there are many potential errors in the way data are entered and retrieved from PAS and this means that the demand (referrals and requests = flow-in), activity (patients seen = flow-out) and the number in the follow-up pool, are often under-reported – especially for those patients with long follow-up intervals. Subsequent calculations may underestimate the appointment slots required to review these patients on time, so it is essential that the team retrieve their data from PAS correctly [3].
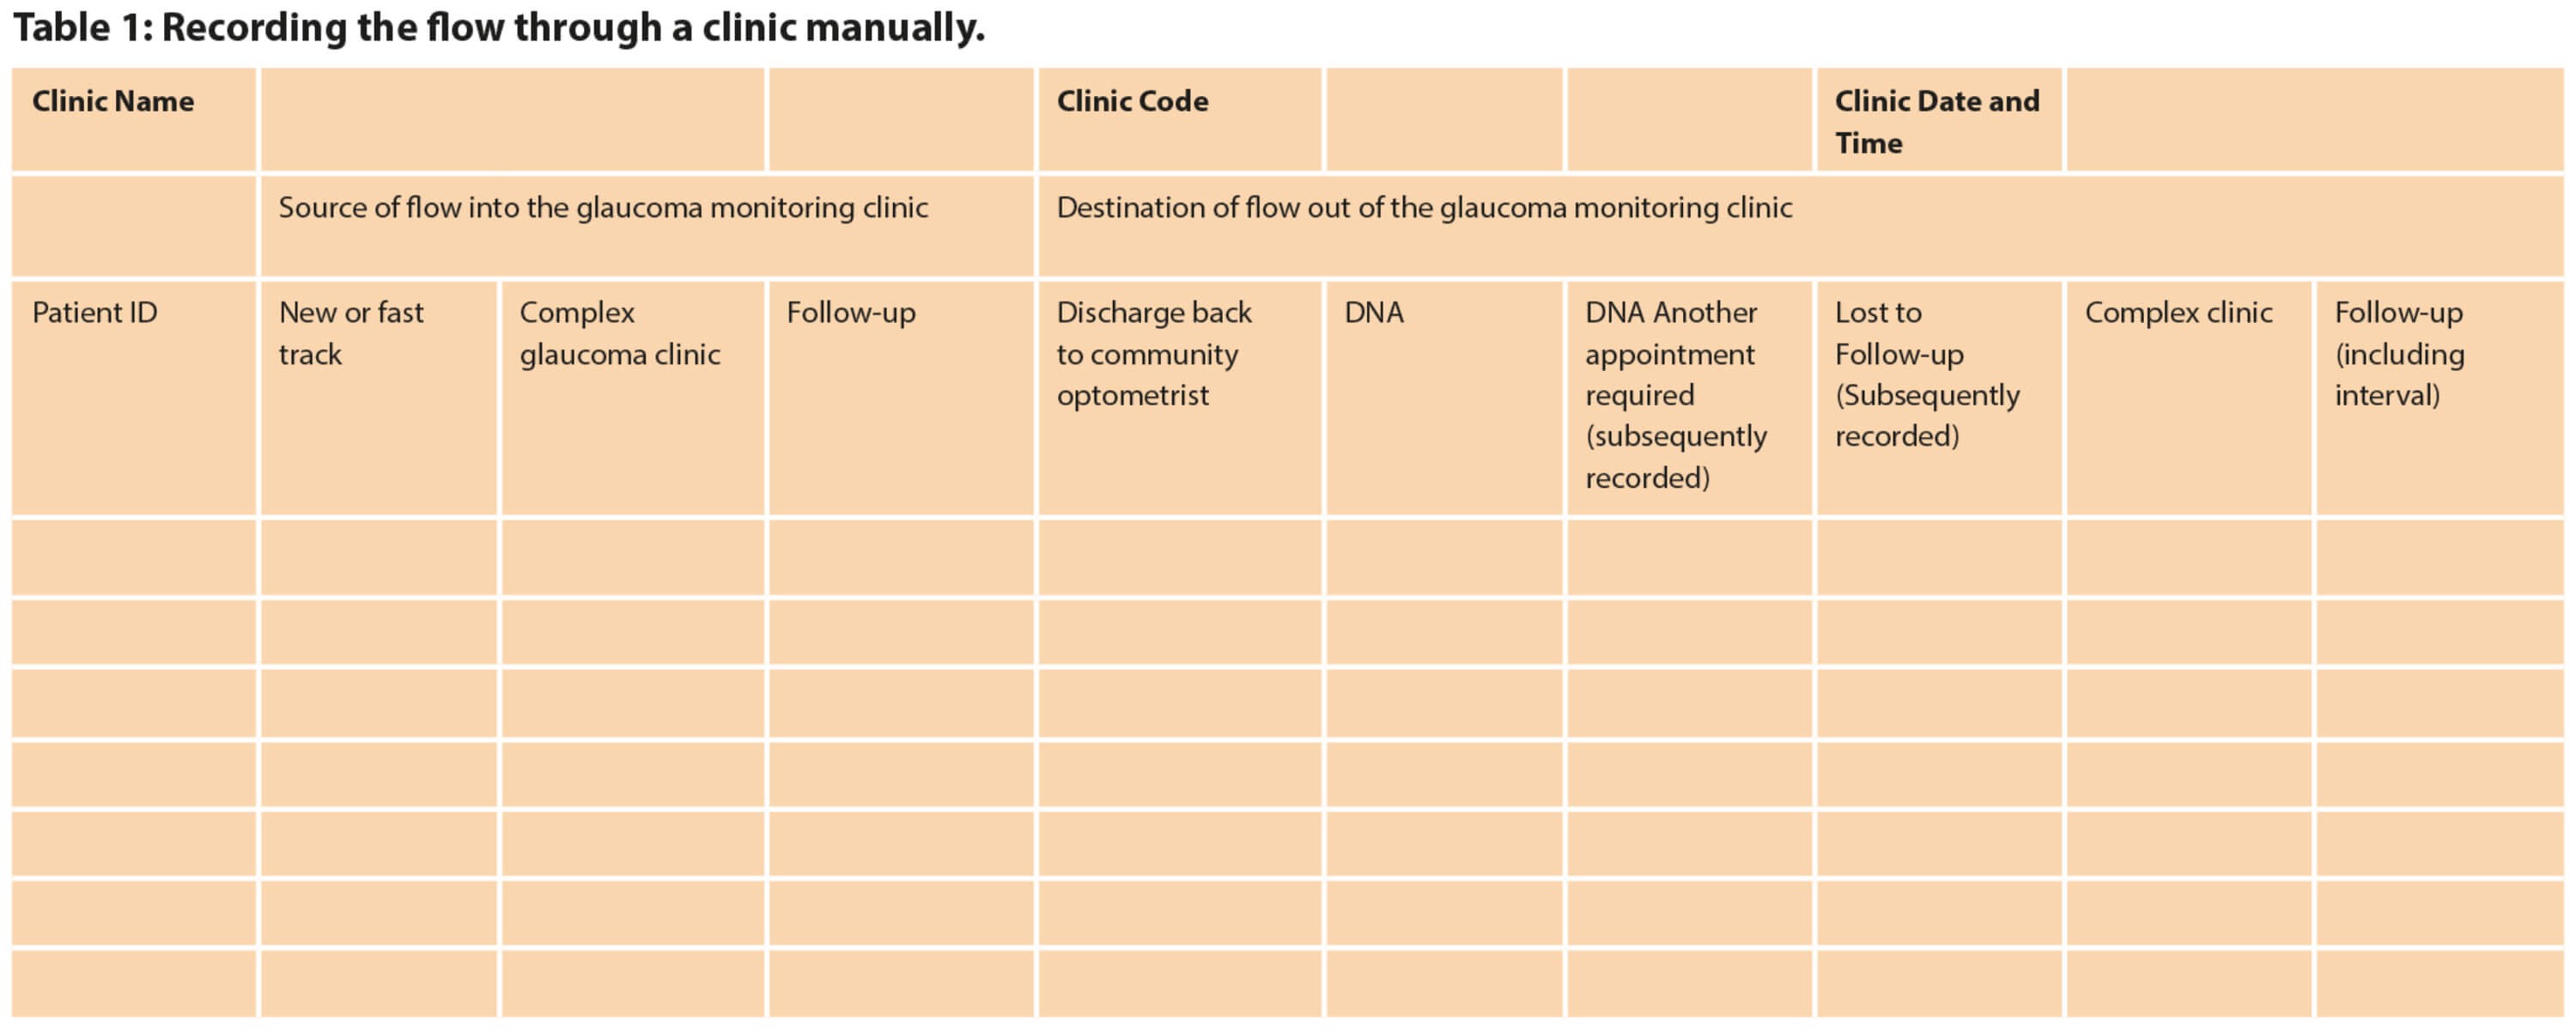
The flows-out can be captured manually by recording the outcomes (DNA, discharge, referral to CGC) as shown in Table 1. The more clinics of the same type that we record, the more robust will be the subsequent calculations.

A plan is needed as to how these data will be collected and who will do it. It is best done by the staff recording these outcomes manually in real-time for several clinics and collating the data sheets. The staff also need to agree as to what to do with the DNAs, i.e. who will find out if the patient still needs and wants to be seen? If the service is notified of patients who no longer need to be seen before their follow-up clinic appointments, how will these data be collated?
Provided there has been no change to the clinical policy regarding the follow-up interval, we don’t need to know the requested follow-up interval (e.g. one month, two months, six months etc.) for the mathematical method to determine the average follow-up demand. However, it is useful to record these for any subsequent dynamic simulations that allow us to predict the impact of changing follow-up intervals.
Modelling the flow through the microsystem
There are three methods for doing this:
- Mathematical models (equations)
- Stock and Flow models
- Discrete Event Simulations.
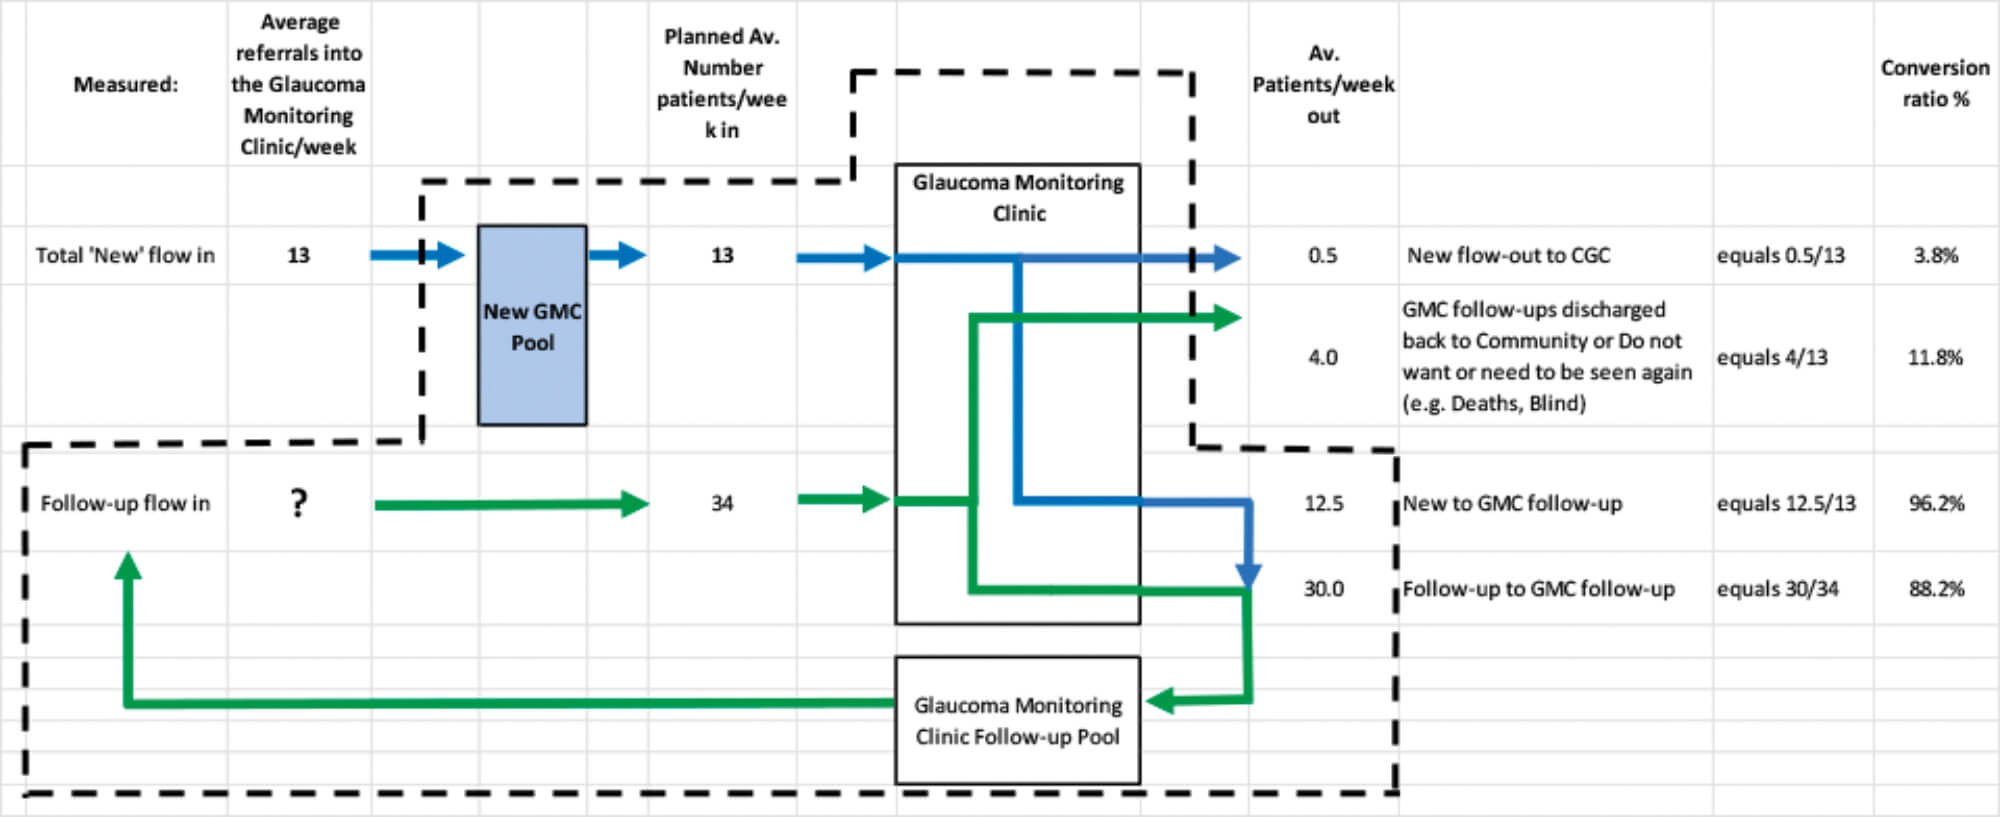
This paper will describe the first method, its advantages and limitations [4,5]. Assuming the referrals into the GMC from the Glaucoma Screening and Fast Track clinics is an average of 10 patients / week and a further three per week are referred back for monitoring from the Complex Glaucoma clinic, the ‘New’ flow into the GMC is an average 13 patients / week. Of these ‘New’ patients, none are discharged but an average 0.5 patients / week (4%) are referred to the CGC. Therefore, an average of 12.5 ‘New’ patients flow into the GMC FU pool / week.
The GMC sees an average of 34 follow-ups / week from the GMC FU pool. Of these, four patients / week (12%) are discharged back to community or do not want or need to be seen again (e.g. do not have glaucoma, have died or gone blind). So an average of 30 follow-ups / week are given a further appointment and returned to the GMC FU pool.
Diagnosis:
We can check that all the current patient flows are accounted for: there are an average of 47 patients / week flowing into and 47 patients / week flowing out of the GMC clinic, but there is a clear mismatch between the flow into and out of the GMC FU pool.
Only 34 FU patients / week from the FU pool are scheduled to be seen in the GMC clinic, whereas 42.5 patients / week flow in, so it is growing by 8.5 patients / week with the inevitable impact on lead-times and clinical safety.
Prognosis:
Given an average flow of 12.5 ‘New’ patients / week into the GMC FU pool, how many FU patients need to flow out of the GMC FU pool / week to keep the GMC FU pool stable?
The number of patients in the FU pool will stabilise when the:
- Flow of new referrals into the FU pool = flow from the FU pool x FU:Discharge ratio
- Flow of new referrals into the FU pool / FU:Discharge ratio = flow from the FU pool
- 12.5/0.12 = 106 FU appointments / week are required to keep GMC FU pool stable.

Figure 2: Modelling the flow through the GMC subsystem.
Calculating the workload and resource-time capacity required for the GMC clinic
The first paper [1] demonstrates how to measure the cycle time for each resource to calculate the manhours required to meet an average workload of 13 new and 106 follow-up = 119 GMC patients / week. Though more resource time may be required, local clinical knowledge and improvement science, e.g Lean [6], will allow staff to identify and free-up their wasted resource time to dramatically improve their productivity (value adding activity / resource time).
The impact of variation
Planning the resource-time capacity required based on average demand and cycle-times doesn’t take into account the actual variations in the demand and case mix changes in the follow-up interval and, more commonly, the variation in resource capacity due to training, audit, holidays and sickness.
Microsystem level: We can’t expect staff to work at 100% utilisation in a clinic, so we need to provide about 15% additional resource time capacity to deal with variations in cycle-times, queries and breaks in the clinic.
Mesosystem level: If the variations in resource-time capacity can’t be eliminated by employing staff who can cross cover for each other when they are away, then every time the clinic activity is less than average, this resource time is lost and additional resource time will have to be provided to ‘catch-up’ and still meet the required lead-times for new and follow-ups. Similarly, the GMC will be subject to changes in flow in the upstream and downstream glaucoma clinics (e.g. consultant staff away, theatre closures etc). Understanding the impact of variation in the micro, meso and macrosystem requires more sophisticated stock and flow or discrete event simulations [4,5].
Reducing system complexity
As well as understanding, reducing and mitigating for the causes of variation in the system, it is useful to think about the impact of the combined effects of a complicated system structure and variation. Figure 1 shows that this glaucoma service (mesosystem) has been ‘divided up’ into seven microsystems, including triage.
The more that the limited resource-time capacity is ‘carved-up’, the more difficult it becomes to schedule the service. This is because there is an increasing chance that the right resource will not be available where and when the patient needs it and there will be an increasing chance that some resource is available but wasted because it isn’t needed at that time. The result is that the effective resource capacity is reduced and this aggravates the delays still further [7]. A vicious, chronic cycle then develops:
- The desire to specialise means that the case-mix needs to be ‘filtered’ (triaged) into the appropriate specialist stream.
- The resource-time is carved out to meet the workload for each specialist stream.
- The variation in demand and case-mix means that there is an inevitable mismatch between the right specialist resource not being available and other specialist resource being wasted because it isn’t needed at that time.
- This reduces the effective resource capacity and creates (or aggravates) delays in the system driving the need for a further cycle to ‘carve-out’ based on urgency. More of the available resource-time is reserved to rescue more vulnerable patients from the growing queue and this makes the system even more difficult to schedule.
- A ‘symptom’ of a system in which the ‘carve-out’ has tipped the system into an unstable state, is that the ‘non-urgent’ patients (low risk new patients or those requiring a longer follow-up intervals) are deferred to the point when the system becomes clinically unsafe.
- To mitigate the risk of harm from the delays, temporary and expensive waiting-list initiatives become chronic, stressing the resources even further.
The way out of the vicious chronic cycle Instead of dividing the resources up to meet the demand based on urgency or source of referral, we should consider the clinical process required, i.e. the tasks, skills and equipment that the patient needs. In this case, are the processes for glaucoma screening, fast track and new and follow-up monitoring any different?
All patients need a history, visual acuities, fields, examination and intraocular pressures, dilating the pupil, photographs and OCT of the optic discs [8]. Therefore, we can reduce the glaucoma mesosystem’s complexity by pooling the demand and resources for the glaucoma screening, fast track and monitoring clinics and then calculating the overall workload for each resource.
Just as a system can be ‘tipped’ into an unstable state by a minimal change in the structure and variation, the beneficial impact of pooling resources on lead-times and stock levels is as dramatic. Pooling increases the chance that the correct resource is available to meet the demand and the service becomes more resilient to variation. As a result, it feels calmer, resulting in longer-term improvements in service quality and productivity [9].
Summary
Many ophthalmology teams are struggling to meet the demand for new and follow-up appointments on time. This paper demonstrates how a team can start to map, measure and model the new and follow-up demand for a clinic. In doing so they may require more sophisticated methods for modelling and mitigating the impact of the variation in their service, but they will also reveal the unnecessary complexity that reduces the effectiveness of the resource-time capacity that they already have. Medical knowledge of the processes and resources required for each clinical condition is required to reduce this complexity and the impact on waiting-times of appropriately pooling resources is dramatic.
References
1. Silvester K: Designing Ophthalmology Services Part 1: How do we address the queues in a clinic? Eye News Online Exclusive:
https://www.eyenews.uk.com/
features/ophthalmology/post/
designing-ophthalmology-services-part-1
-how-do-we-address-the-queues-in-a-clinic
2. Little JDC. A Proof for the Queuing Formula: L = λW. Operations Research 1961;9(3):383-7.
3. Silvester K. Diagnosing the Flow Constraint in an Endoscopy Service. Part 1: Recognising and Avoiding the Data Query Trap. Journal of Improvement Science 2016:38;1-23.
4. Dodds S. Community Wound Care Service Improvement Guided by a Whole System Simulation Model. Journal of Improvement Science 2012:5;1-14.
5. Dodds S. A Case Study of a Successful One-Stop Clinic Schedule Design using Formal Methods. Journal of Improvement Science 2012:6;1-13.
6. American Academy of Ophthalmology:
https://www.aao.org/practice
-management/lean-management
7. Kingman JFC. The single server queue in heavy traffic. Mathematical Proceedings of the Cambridge Philosophical Society 1961;57(4):902.
8. National Institute for Health and Care Excellence (NICE) Pathway: Glaucoma.
http://pathways.nice.org.uk/
pathways/glaucoma
9. Jones C, Dodds S. Improving the Delivery of Chemotherapy: Part 6. Using Complex Physical System Modelling and Re-Design to Restore the Calm. Journal of Improvement Science 2019:62;1-22.
(All links last accessed February 2020)
TAKE HOME MESSAGE
-
Healthcare Systems Engineering techniques can be used to calculate the number of follow-up appointments required to keep the follow-up pool stable and therefore the time between follow-up appointments predictable.
-
The number of patients in the follow-up pool for a chronic condition (e.g. glaucoma) cannot grow indefinitely. It has to stabilise when the flow into the follow-up pool = flow from the follow-up pool x FU:Discharge ratio.
-
For some conditions the discharge rate may be the DNA-due-to-death rate and the number in the follow-up pool may be very large.
-
Once we know the number of new and FU appointments required per week, we can calculate the resource-time required to make the system safe and productive.
Declaration of competing interests: None declared.
Acknowledement: The author would like to thank the team at George Elliot Hospital, Nuneaton for their data.
Part 1 of this series can be found here
Part 3 of this series can be found here
COMMENTS ARE WELCOME


