In 1929 Belgian surrealist Rene Magritte produced his painting La Trahison des Images. It depicted an old fashioned pipe for smoking tobacco and underneath were the words “ceci n’est pas une pipe”, this is not a pipe. You may wonder where I’m going with this and what is has to do with optical coherence tomography (OCT scanning).
For the majority of patients attending the modern ophthalmology clinic, their assessment is not complete without an OCT scan. It is ubiquitous and almost inescapable. Since its inception in the 1990s it safe to say that OCT scanning technology has progressed rapidly and capabilities of scanning machines are continuing to improve at a heady rate. Such beautifully detailed images are produced, even depicting individual photoreceptors, such that it would be easy to forget that we are looking at an image and not the real thing. It behoves the trainee ophthalmologist to have some understanding of how these wonderfully detailed images are produced so that they may be interpreted correctly lest we forget they are an image and not indeed an actual anatomical section.
When Magritte was asked to explain his painting, he replied that of course it is not a real pipe. Just try to fill it with tobacco!
Principles of OCT scanning
Understanding the principle of how an OCT image is produced is fundamental to understanding the image itself. OCT is an acronym for optical coherence tomography. Optical, referring to electromagnetic radiation in the visible spectrum, coherence, referring to the phase of the light wave and a tomograph is simply a slice or section.
Here, it is useful to remember that light may be described as both a wave and a particle called a photon. A concept called wave-particle duality described by Einstein. When photons encounter matter, they interact with it in a variety of ways. They may be transmitted, i.e. pass straight through the object. If their path is un-deviated, they are called ‘ballistic photons’ or if they deviate a little, they are charmingly named ‘snake photons’, or they may experience a number of other interactions including absorption, polarisation and reflection, to name a few. It is largely the reflected photons we are interested in here.
“It is useful to remember that light may be described as both a wave and a particle called a photon.”
The technique employed in OCT scanning is called ‘low coherence interferometry’. Coherence refers to the phase of light waves, i.e. if the peaks and troughs of the light waves coincide or are ‘in phase’. Laser light is an example of a highly coherent light source of a specified wavelength, compared with my kitchen light bulb, which emits non-coherent light and contains many wavelengths.
During OCT scanning, non-coherent, broadband light is directed at the sample to be analysed, e.g. the retina. Reflected light is detected and analysed with respect to a reference beam which did not interact with tissues. An image of the tissues is then computed based on the change in the light caused by the interaction with tissue (Figure 1).

Figure 1: The basic principle behind OCT scanning.
Variations in the type of light source, detector and analysis is what gives us differences in the various generations of OCT scanning, for example, time domain, spectral domain or swept-source OCT.
Time domain OCT
The first type of OCT scan developed in the 1990s was time domain OCT (TD-OCT), which has now largely been superseded by other types of OCT. It was so called as it involved measuring the time taken for light to be reflected back from tissues, an ‘optical echo’, if you like. The light source is a superluminescent diode which is a broadband light source containing a range of wavelengths, usually in the near infrared range of around 840nm. The machine involved a moving reference mirror in order that light from the reference arm and the sampling arm should have travelled the same total distance allowing for direct comparison. The reflected light is detected by a photodetector and is then analysed in terms of constructive and destructive interference patterns to produce many A scans of the tissues. This technique is called interferometry (see Figure 2).

Figure 2: Interference patterns.
The A scans are then summated to produce B scans, i.e. a tomograph. The major limitation of this system is due to the mechanically moving mirror. Moving parts are slow and it only allowed acquisition speeds of around 400 A scans per second. This allows the patient plenty of time to blink and make some saccades and limits the resolution of the scan to around 10 microns or 0.01mm.
Spectral domain OCT
A significant advancement was made with the development of spectral domain OCT (SD-OCT) in 2002. The main improvement was in the method of detection and analysis of the reflected signal. The detector used is a charged coupled device spectrometer (CCD). These are widely used in many optical instruments including digital cameras and telescopes and were even used to detect cosmic background radiation from the beginning of the universe. They are light sensitive silicon chips, which detect and store the data for a picture or picture elements, better known as pixels. Incident photons release electrons in the chip and are converted into a charge and stored. The size of the charge is dependent on the wavelength of the incident light. CCDs contain several rows or even grids of pixels allowing simultaneous measurement of multiple wavelengths of reflected light across a spectrum, hence the name spectral-domain. As you may imagine, CCDs allow very fast acquisition of pictures and indeed scanning speeds are 100 times faster than TD-OCT, allowing 40,000 A scans per second. This means finer resolution of around 3 microns, and less time for the patient to blink or make a saccade.
A disadvantage of the CCD is that it is not as good at detecting reflected light from deeper structures such as the choroid due to increased scattering of light from deeper tissues, particularly the retinal pigment epithelium (RPE). This results in a greater ‘signal to noise ratio’ from the deeper retinal structures compared with the superficial ones. The commonly used phrase for this is ‘sensitivity roll-off’.
The data from the CCD is analysed by fourier transform. I am not a mathematician, but I will attempt to explain this simply. Given a fruit smoothie, fourier transformation is a mathematical way of working out the original recipe, for example, two bananas, five strawberries, 10 raspberries and a star anise. Why do we want the recipe? It is easier to analyse and compare than the smoothie itself. Given the spectrum of light detected by the CCD, fourier transform is used to turn it back into its component light waves (Figure 3).

Figure 3: Fourier transformation breaking down a wave into its constituent parts; deconstructing a smoothie.
These then produce the usual constructive and destructive interference patterns and allow us to build a picture of the retinal tissue. Quite simply, fourier transformation allows orders of magnitude faster processing, literally transforming the speed of imaging.
Swept-source OCT
Swept-source OCT (SS-OCT) involves a different kind of light source to SD-OCT. A laser light source ‘sweeps through’ a range of wavelengths sequentially in rapid pulses. The detector is not a CCD spectrometer, but a photodetector as in TD-OCT, conferring the advantages of improved signal to noise ratio. As with SD-OCT the reflected light undergoes fourier transformation and interference patterns are analysed to produce an image of the retinal tissues. An advantage of SS-OCT is that it uses longer wavelengths of around 1050nm which penetrate deeper into tissues, allowing better visualisation of deeper structures, e.g. the choroid. Scanning speeds are up to 100,000 A scans per second.
“Quite simply, fourier transformation allows orders of magnitude faster processing, literally transforming the speed of imaging.”
OCT angiography
These machines became commercially available in around 2014. Some readers may not have seen one outside a trade exhibition as yet, however, they are becoming more widespread and it would be sensible to have an idea how they work. They allow non-invasive imaging of retinal and choroidal blood flow. The obvious advantages are that no cannula or injection is required and there is no risk of adverse reactions to dye. Wonderful, from both the patient’s and doctor’s perspective.
The basic assumption of OCT-A is that the only moving objects in the retina are blood cells within vessels. For technical reasons OCT–A, unlike ultrasonography, does not utilise the Doppler effect. One of the more easy to appreciate reasons is that many of the blood vessels in the retina are perpendicular to the scanning beam, so that the blood is not moving away or towards the light for there to be much of a Doppler shift.
During OCT-A, moving blood cells in vessels reflect light from the long wavelength swept-source which is illuminating them. Two or more B scans are performed in quick succession at each retinal location. Since we are looking at volume information in OCT-A, a new term to appreciate here is the ‘voxel’, which is a three dimensional version of the pixel. The two B scans are compared. The way that the picture is produced involves a great deal of complicated computer processing. Many algorithms have been devised which all seem to have names so long that acronyms are a necessity. A particularly successful one is called split spectrum amplitude decorrelation angiography (SSADA). The ‘split spectrum’ part refers to the fact that that the spectrum of reflected light is split into chunks or sections of narrower bandwidths for the purposes of calculation. These are then compared between the two B scans to measure ‘decorrelation’, which is, broadly, the degree to which the two scans differ. From this, can be worked out where the moving blood cells are and therefore the location of vessels. Unlike Doppler, it does not calculate a flow velocity. It simply shows that there is flow. The assumption is that this flow must be within vessels.
OCT-A pictures of the retina are quite unlike fluorescein or indocyanine green (ICG) angiography in that they delineate vessels with blood flow within them. They do not indicate the nature of vessels, for example, pathological leakage. Interpreting OCT-A pictures is therefore a new skill to be acquired.
Manufacturers’ modifications – ‘pimp my OCT’!
Anyone who has attended the trade exhibits at a conference will know that manufacturers of OCT machines are keen to tell us about their latest gadget, each with their own unique modifications which set it apart from the crowd. Ironically it becomes increasingly difficult to distinguish what is a genuine advantage and what is a gimmick with a pithy name.
The modifications fall broadly into two groups. Either they are improvements in image acquisition, which is usually a hardware modification, or improvements in post acquisition processing, which is largely software.
Improvements in image acquisition:
- Eye tracker. This is hardware to reduce motion artefact at the time of scanning. Anyone who has ever performed an OCT scan will know the difficulties sometimes encountered with fixation. There are some patients whose vision is too poor to fixate well and others who simply don’t fixate well for a variety of reasons. This can lead to a poor quality scan due to motion artefact. Fortunately many devices offer eye tracker systems. These typically employ two incident light beams. One beam is used to map 1000 or so retinal locations, which are used to create a reference map of the retina. The second beam is used to acquire the scan itself. In this way the scanning beam is always directed at the desired location irrespective of eye movements. An example of this is TruTrack™ by Heidelberg Engineering. It is also useful when patients undergo sequential scans over time as it ensures that the same retinal location is scanned on each follow-up visit.
- Enhanced depth imaging (EDI). This really refers to being able to see beyond the RPE. As we already learned, SS-OCT systems, for example the DRI OCT Triton by TOPCON, can provide improved scanning of deep structures including the choroid. If, however, like most NHS departments your budget is limited, your SD-OCT can also produce enhanced depth images by pressing the ‘EDI’ button. This technique was originally described by Richard Spaide in 2008. SD-OCT collects tissue depth data by setting a fixed reference line called the zero-delay line. All depth measurements are compared with this line. It’s rather like measuring the heights of mountains relative to sea level. The zero delay line is the point of maximum sensitivity of the scan. As we discussed earlier there is a ‘sensitivity roll-off’ with increasing distance from this line, in particular, scattered light from the RPE, which prevents good imaging of the choroid. In standard OCT scans the zero-delay line is set at the vitreoretinal interface, allowing the retinal structures to be seen with the best resolution. Spaide noticed that if the scanner was too close to the patient’s eye, then an inverted image was produced which showed the choroid well. What he deduced was that the zero delay line was pushed posteriorly to the level of the outer retina-RPE junction. An EDI scan performed using an SD-OCT such as the Spectralis SD-OCT system by Heidelberg Engineering uses software which shifts the zero delay line posteriorly and averages multiple images to produce better images of the choroid.
Widefield OCT
Standard SD-OCT scans cover a 30 degree field of view. SD-OCT machines can be modified with widefield lenses and a software upgrade to scan 55 degrees of field. The advantage here is that the disc and macula can be captured in a single image.
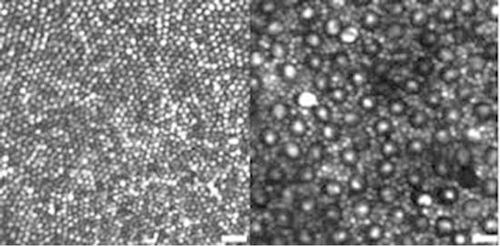
Figure 4: Rods and cones visualised through adaptive optics.
Adaptive optics
Impressive pictures of rod and cone photoreceptors have been produced using this technique. It is largely used in research, but I have included it here as the pictures are stunning (Figure 4). In any optical system, including the eye, optical aberrations occur. Lower order aberrations include astigmatism and defocus as in myopia or hypermetropia. Higher order aberrations cause distortion to the wavefront and include trefoil, coma and spherical aberrations. The resolution of OCT images produced is limited by these higher order aberrations. Adaptive optics removes some of these aberrations by measuring distortions in the wavefront and corrects them by means of a deformable mirror (Figure 5).
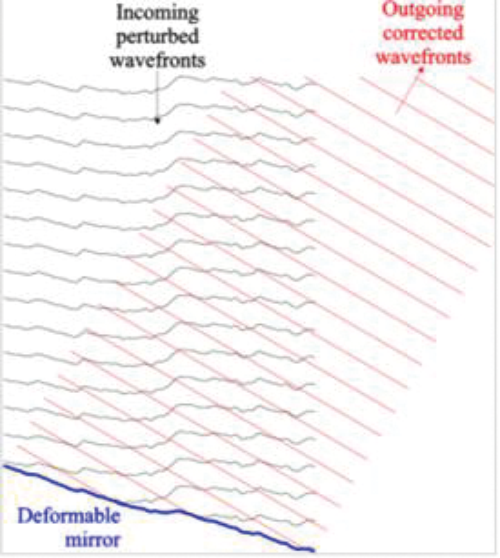
Figure 5: Deformable mirror correcting wavefront aberrations in adaptive optics.
Post acquisition image processing
This involves manipulating images with software to make them more understandable and useful to us as clinicians. Software manipulations have improved progressively, in line with scan resolution. Examples include three dimensional volume scans, which may help us to assess if a patient’s macular oedema is improving, ‘en-face’ (coronal) pictures, which show us the location of pathology within retinal layers, and also scans showing the thickness of the retinal nerve fibre layer at the optic nerve, aiding in assessing and monitoring glaucoma. There are innumerable other software manipulations available.
The key point to appreciate here is that without good quality scan data these manipulations are not possible.
Future developments
OCT technology is not standing still. Many developments are on the horizon and some are already available in research settings. Polarisation sensitive OCT, for example, uses the polarising properties of retinal tissues to differentiate them and identify pathology. The retinal nerve fibre layer demonstrates birefringence, whereas the RPE has depolarising properties. Reduced birefringence is seen in glaucomatous eyes.
Much advancement has involved integrating OCT technology into other devices, such as operating microscopes, to give intraoperative OCT imaging. Handheld OCTs may also be useful intraoperatively, for example, during tumour resections. Portable OCTs are on the horizon. I greatly look forward to the day when I can stand on the other side of the room and perform a retinal OCT like a policeman in a speed trap.
Conclusion
As we have seen, OCT scanning has progressed rapidly and, like the Doppler shift of a passing emergency vehicle, it threatens to pass us by unless we make some effort to understand the sometimes sci-fi like technical terms used to explain it. In understanding a little more about how these impressive pictures are created, it perhaps helps us to reflect upon Rene Magritte’s surrealist message that they are still man-made images merely representing a real live thing.
COMMENTS ARE WELCOME