Introductory statistics courses often start by explaining how data can be classified in different ways. What is not always clear is why you would need to know this. Catey Bunce and Tafadzwa Young-Zvandasara explain.
The term data can be applied to just about anything. Whilst people typically use the term to describe measurements made in a study such as intraocular pressure recordings or visual acuities scored using an ETDRS chart, data can also be used to describe eye colour, whether or not a patient is satisfied with their surgery, grade of surgeon, surgical experience etc. Introductory statistics courses often start by explaining how data can be classified in different ways. What is not always clear is why you would need to know this.
Data by itself can be meaningless. Statistical methods attempt to convert data into meaningful information that might answer a research question that you have. There are different types of statistical methods – inferential where statistical tests of hypotheses and confidence intervals are discussed and descriptive methods.
Inferential statistics covers tests that were taught during medical school – t-tests, chi-square tests, the Wilcoxon Signed Rank test etc. These tests are used to decide if groups are different to each other (or more strictly speaking the average value of these groups are different) or whether there are associations between the measurements that you have made than are greater than you would be likely to observe by chance alone (under a null hypothesis).
Descriptive statistics is used for the methods used to simply summarise your data. If you have a study where intraocular pressure has been measured on the right and left eyes of 100 patients and someone asks you about your data, they would most likely be overwhelmed if you started detailing every single measure on every single eye. Instead of this, you would most likely give an average value (such as the mean or median) and a measure of variability (such as the standard deviation or perhaps the range).
If you pick up a statistical text book there will be lists of different types of statistical tests but how do you know which test to use? One step towards identifying the right method is to identify the type of data that you have. To do this, you need to be able to classify your data. Having said that, there is another tip for surviving statistics. Often statistics is not black and white in the same way that mathematics is. In formal mathematics there is often a correct way of doing things and an incorrect way of doing things. In statistical analyses whilst there can indeed be correct ways and incorrect ways, sometimes correctness is based on whether or not an assumption is adhered to and sometimes this decision is not that clear cut.
There are different ways of classifying data but one method is to consider whether the data are quantitative or categorical.
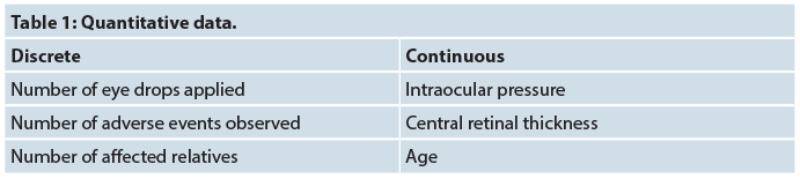
Any data that are obtained by some method of measurement is quantitative data. Quantitative data can itself be divided into continuous data or discrete data. Continuous data lies on a continuum, i.e. any value is valid between range, e.g. weight, height. Discrete data, in contrast, can only take certain values – usually integers, often counts.
Whilst sometimes it is very clear whether data are continuous or discrete, sometimes it is not so clear cut and often data that are discrete are routinely analysed as continuous. Ideally, where this happens it is in the case that there are a large number of possible values but this is not always adhered to. One question you might ask is how large is large? You may get different answers from different statisticians and some even who argue that the number is irrelevant. A rule of thumb used by some, however, is that 10 or more is sufficiently large in this context, four or less is not. An example of this would be that heart rates in beats per minute is strictly discrete but often analysed as continuous. Continuous data is sometimes recorded in a study in a discrete fashion – e.g. age may be collected in age bands. This is something to try to avoid if you are in control of the study. This is because you can always convert the actual age to an age category, but given an age within an ageband you cannot determine the actual age.
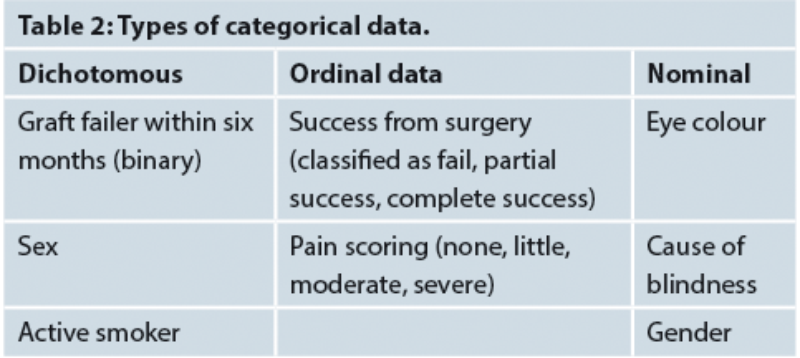
Data that are not measurement data are termed categorical data because they typically fall into one of a number of different categories. On some occasions there are only two possible categories that data can take and an example of this would be whether someone is dead or alive. These data are called dichotomous or binary data. Sometimes there are many possible categories (polychotomous) and these may or may not have an order to them. If they can be placed in order, they are called ordinal data. If they cannot, they are called nominal data (Table 2).
There are, however, other ways of classifying data types and one thing to consider is the relationship between different items of data. Are your data items related to each other or are they independent? They can be regarded as independent if they have no relationship between each other, for example, blood pressure measurements on a random group of people might be viewed as independent. If, however, we were to measure blood pressure on a patient before and after treatment, this would be viewed as related data (dependent).
One issue that comes up a lot in the analysis of data captured within studies on eyes and vision is whether or not fellow eyes can be treated as independent. The simplest answer is that fellow eyes within one person’s head are never truly independent, however, sometimes this is not strictly adhered to [1].
In summary, therefore, there are different ways of classifying data but the reason that it is important to be able to classify data is so that you can then apply a statistical method to convert your data into meaningful information that answers your research question.
Reference
1. Bunce C, Patel KV, Xing W, et al; Ophthalmic Statistics Group. Ophthalmic statistics note 1: unit of analysis. Br J Ophthalmol 2014;98(3):408-12.
Further reading
-
Peacock JL, Kerry SM, Balise RR: Presenting Medical Statistics from Proposal to Publication (second edition) Oxford University Press; 2017.
-
NIHR Statistics Group:
https://statistics-group.nihr.ac.uk/research/new-sections/
TAKE HOME MESSAGE
-
Statistical methods attempt to convert data into meaningful information that might answer a research question that you have.
-
There are different ways of classifying data but one method is to consider whether the data are quantitative or categorical.
Part 2 of this topic is available here.
Part 3 of this topic is available here.
Part 4 of this topic is available here.
COMMENTS ARE WELCOME