The overall goal of the Global Vision Database (GVD) [1] is to develop and deploy new and improved evidence on the prevalence of blindness and vision impairment (VI) globally. It is a repository which allows us to assess the causes of blindness and VI, intervention coverage, and to inform and influence global priorities and programs.
Accurate and credible global statistics on the magnitude, distribution, trends and causes of vision impairment and blindness are important to provide evidence that underpins appropriate public health policies, health service planning and financing at all governance levels. This is a key requirement of the World Health Organization’s (WHO) Global Action Plan for Universal Eye Health 2014-2019 [2].
The purpose of the GVD can be summarised as follows:
- Provide accessible global estimates for the prevalence of blindness and vision impairment as well as the associated risk factors.
- Advise WHO and other international organisations on the most appropriate methods and assumptions for their global, regional and country level eye health epidemiological estimates.
- Advise researchers and public health officials on the different issues involved in the estimation of cause-specific blindness and vision impairment.
- Act as repository of high quality population-based studies of blindness and vision impairment data, in order to heighten accuracy of estimates and to securely preserve datasets into the future.
The database currently contains information from more than 250 population-based eye surveys (over three million ocular examinations!) from both published and unpublished sources. Principle investigators from many studies have contributed more detailed data than is available from the published reports (microdata). More of this microdata and full datasets have been donated / pledged in order to inform a new set of estimates due to be released in early 2016.
The collaboration behind the database
The Global Vision Database has been established by an international consortium of 79 ophthalmologists and optometrists with an interest in the epidemiology of eye disease. The group works with members of the WHO. This group (called the Vision Loss Expert Group (VLEG) [3]) was created originally to assist the Global Burden of Disease Study (GBD) [4] in its quest for population-based data on prevalence of vision loss in order to prepare estimates of Disability-Adjusted Life Years (DALY) for all diseases. These estimates were published for 2010 (GBD 2010) and the group continue to assist the GBD Study with subsequent outputs (GBD 2013).
How is this model / approach an improvement on previous estimates?
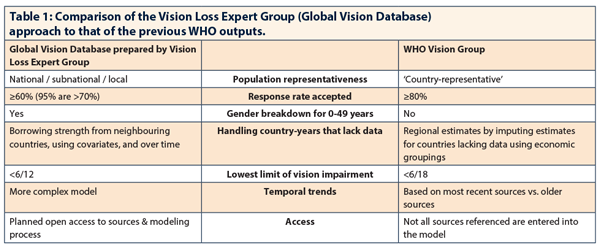
Previously, the WHO published estimates intermittently for limited time frames, age groupings, and gender. Table 1 compares the Vision Loss Expert Group (Global Vision Database) approach to that of the previous WHO outputs.
Likewise, prior to the advent of the VLEG, the previous Global Burden of Disease studies in 1990 utilised different methodologies. They also exhibited inconsistencies and had limited mention of vision loss.
The unification of a broad, global, interdisciplinary coalition of ophthalmic research expertise in the VLEG (in collaboration with WHO and GBD) ensures exceptionality in the identification and evaluation of published and unpublished quality data sources. This ensures that all major epidemiologic studies of the prevalence of vision impairment (which meet strict inclusion criteria for national representativeness, validated methodology and clear impairment definitions) contribute to greater precision of global temporal estimates
How is the database used to create global / regional / country blindness / vision impairment prevalence estimates?
1. The Systematic Review and the data sources that are in the database
A systematic review of medical literature published from 1 January 1980 to July 2012 was performed [5]. We identified indexed articles containing data on incidence, prevalence and causes of blindness (presenting visual acuity <3/60) and moderate and severe visual impairment (MSVI); presenting visual acuity <6/18 but ≥ in the better seeing eye), obtained from only cross-sectional population-based representative studies. Studies that were included in the Global Vision Database met the following Inclusion criteria:
- Reported prevalence of blindness and / or VI was measured from random sample cross-sectional surveys of representative populations of any age of a country or area of a country. Studies using hospital or clinic case series, blindness registries and interview studies with self-reported vision status were not included.
- Definitions of VI or blindness were clearly stated, using thresholds of visual acuity, in the better eye that matched or could be later modeled to match to the following definitions: mild vision impairment (<6/12 to 6/18); moderate vision impairment (<6/18 to 6/60); severe vision impairment (<6/60 to 3/60); blindness (<3/60).
- Best-corrected and / or presenting visual acuity was required.
- Procedures used for measurement of visual acuity needed to be clearly stated.
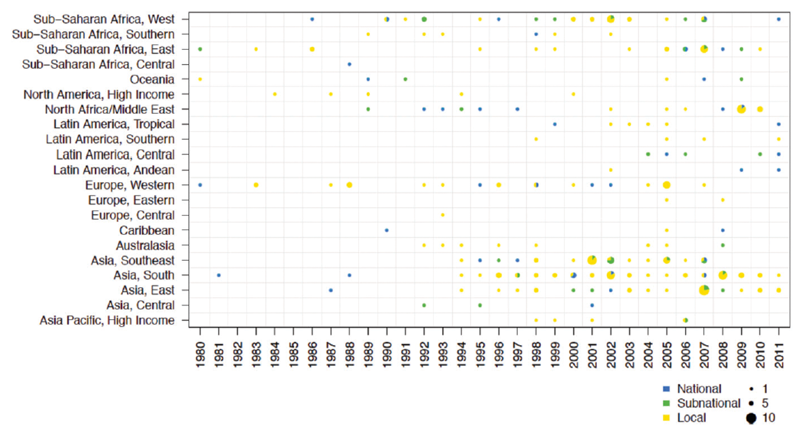
Figure 1: Data availability for studies conducted between 1980 and 2012, identified by the Global Burden of Disease (GBD) study systematic review that reported distance visual acuity sequelae, organised by region, with survey year and population representativeness highlighted. The population sampled by each study is represented as either national in scope, that of a first administrative unit or greater (includes state or regional) or a local / district level.
A global map of data sources with national or subnational (defined in this study as a first administrative unit or greater, which includes a state or region) data is given in Figure 1.
Among the 238 studies reporting distance VI prevalence data identified, 40 were nationally representative, 36 were subnational and 162 were local (a community or several communities together). At least one study was identified for each GBD study region, but there were no national-level studies identified in six of the GBD study regions (Asia-Pacific high-income, Australasia, Central Europe, Eastern Europe, North America high-income, or Southern Latin America). No study was identified for 103 countries (of 190), and no nationally representative study was identified for 155 of 190 countries. Data on childhood VI were particularly sparse. We identified only 45 studies that reported prevalence data for children or youth under 18 years of age, of which 10 were nationally representative studies.
Many studies were excluded on the basis of the definitions used for vision loss categories, where the published data presented cut-offs of visual acuity that did not match those used by the WHO and the GBD study. In some instances we were able to access unpublished data from these studies in order to extract data that could be categorised according to the visual acuity categories used by the WHO and GBD study, but most such studies had to be excluded. This is unfortunate given the effort involved in conducting these studies and their potential to enhance the information provided in this review. Future surveys should include careful reporting of visual acuity data in accordance with the WHO guidelines at the time. The dearth of data relating to VI in children was unsurprising given the larger population sample and resources required to obtain a precise estimate of prevalence of VI in this age group. The majority of studies on younger age groups did not meet the inclusion criteria [6][7].
The increased number and broader distribution of recent data sources underscores an increase in population-based studies conducted in the 2000s compared to previous decades. However, there remains a dearth of such information from certain world regions such as Central Africa and Central and Eastern Europe, the Caribbean and Latin America.
There was also a shortage of national studies which increases the uncertainty around prevalence estimates in these countries and regions. Subnational studies may not reflect the prevalence of VI/B that exists due to the unequal distribution of eye care resources in some developing countries. Rapid assessment surveys [8] were particularly useful in that they had often been performed in regions where published data were sparse [9-10].
Additionally the results of these surveys are centrally collated [8] with the benefits of accessibility and a standardised use of vision loss category definitions and methodology. Interestingly, nationally representative studies were less common in high-income countries. Of the countries where representative population-based studies had been undertaken, most were single studies in a 28-year period.
2. The analysis of the data sources to estimate vision loss prevalence [11].
We estimated trends in vision impairment prevalence and their uncertainties, by sex, for 190 countries in the 21 GBD subregions between 1990 and 2010. Vision impairment prevalence was based on presenting visual acuity. Our analysis was carried out in four steps:
Step 1: Conversion of vision impairment data to two core levels (blindness and MSVI).
Not all prevalence data reported in the literature use the definitions of vision impairment selected for this study. To include prevalence data reported using other definitions of vision impairment, we developed logistic regressions to convert the prevalence of vision impairment using other severity thresholds to the core categories used in this analysis.
Step 2: Estimation of age-specific vision impairment prevalence when data were not reported by age.
If data were reported by age, age-specific prevalence of vision impairment was used. In some cases, the prevalence of vision impairment was reported for a wide age group such as all ages or adults 50 years of age and older. We fitted two universal age patterns, one for the prevalence of blindness and one for the prevalence of MSVI, using study data that were available by age. We then applied the fitted age patterns to data that were available only by wide age group to calculate prevalence by five-year age intervals.
“Prevalence of blindness and vision impairment over the past 20 years is declining – powerful evidence that the fight to eliminate avoidable blindness and vision impairment is being won.”
Step 3: Selection and use of a statistical model to estimate the prevalence of blindness and MSVI by country, age, sex and year.
We fitted two hierarchical logistic regressions to estimate vision impairment prevalence over time by age group, sex and country. We fitted one model for the prevalence of blindness and one model for the prevalence of MSVI to reflect differences in geographic patterns and trends for the two levels of vision impairment. By using a hierarchical model, estimates of vision impairment were informed both by study data from the same country, if available, and by study data from other countries.
We modeled hierarchical linear trends over time, allowing for region-specific trends in the prevalence of vision impairment in four world regions. The difference in prevalence by sex likewise was modeled hierarchically in four world regions, which allows for differences in sex disparities in underlying risk of vision impairment or access to ophthalmologic care. Our model includes study-specific error terms, which have a larger variance for subnational and community studies, thereby allowing national studies to have a greater influence on estimates. We accounted for variation in reporting of prevalence by best-corrected or by presenting vision in our model by fitting a fixed effect model for data recording presenting visual acuity.”
We evaluated three country-specific covariates for which a complete dataset for 190 countries from 1980 through 2011 was available: gross domestic product per capita, mean years of adult education, and a variable representing access to healthcare. To select the model that made the most accurate predictions for countries without data, we calculated the predictive validity of all combinations of the candidate covariates using cross-validation. For both blindness and MSVI, the best performing model used only mean years of adult education and health care access as covariates.
Step 4: Conversion from the prevalence of MSVI to the prevalence of severe and moderate vision impairment.
Finally, we predicted the prevalence of severe and moderate visionn impairment for the central estimate, and confidence intervals for each country, year, age and sex.
The global burden of vision loss [11]
Globally, 32.4 million people (95% confidence interval [CI], 29.4-36.5 million people; 0.5% of the global population [95% CI, 0.4-0.5% of the global population]) were blind in 2010. Of this figure, 19.6 million (95% CI, 17.7-22.1 million; 60%) were women. The largest number of blind people resided in South Asia (10.6 million; 95% CI, 8.4-12.5 million), followed by East Asia (5.2 million; 95% CI, 4.5-6.5 million), and Southeast Asia (3.5 million; 95% CI, 2.7-4.1 million). The prevalence of blindness varied from 0.1% (95% CI, 0.1-0.2%) in the North America high-income region to 0.7% (95% CI, 0.5-0.9%) in the North Africa and Middle East region.
An additional 191 million people (95% CI, 174-230 million people) had MSVI (2.8% of the global population; 95% CI, 2.5%-3.3% of the global population), of whom 109 million people (95%CI, 99-130 million people; 57%) were women. Of those with MSVI, 30 million people (95% CI, 1.4-157 million; 16%) had a severe vision impairment, and 161 million people (95% CI, 41-211 million) had a moderate vision impairment. We estimated mild vision impairment from MSVI prevalence, calculating that 155 million people (95% CI, 64-354 million people) worldwide had mild vision impairment in 2010.
The burden of vision impairment was greatest among those 50 years of age and older. This age category comprised 84.6% of all blind people and 77.5% of all those with MSVI.
When controlling for age, the female prevalence of blindness was greater than male prevalence in all world regions. For blindness, the relative sex disparity was greatest in the high-income regions; the adult age-standardised prevalence of blindness in women was estimated to be more than 1.5 times higher than the age-standardised prevalence of blindness in men. The sex disparity was lowest in the Sub-Saharan African regions, with blindness in women approximately 1.11 to 1.13 times greater than blindness in men, and in the South Asia region, where adult blindness was 1.26 times greater in women.
Only a small number of population-based surveys including near vision impairment met the GBD inclusion criteria. These studies suggested that the prevalence of presbyopia ranged from 70% in those over 30 years (in South India) [12] to between 44% and 62% in those over 40 years (in Timor-Leste and Tanzania) [13, 14], and up to 84% in those over 50 years (in Kenya) [15]. The burden of uncorrected presbyopia was high in these studies, which were based in regions where access to eye care services was limited and spectacles were relatively unaffordable. For example, 73% of presbyopes in Timor-Leste [14] and 94% presbyopes in Tanzania [13] did not own spectacles.
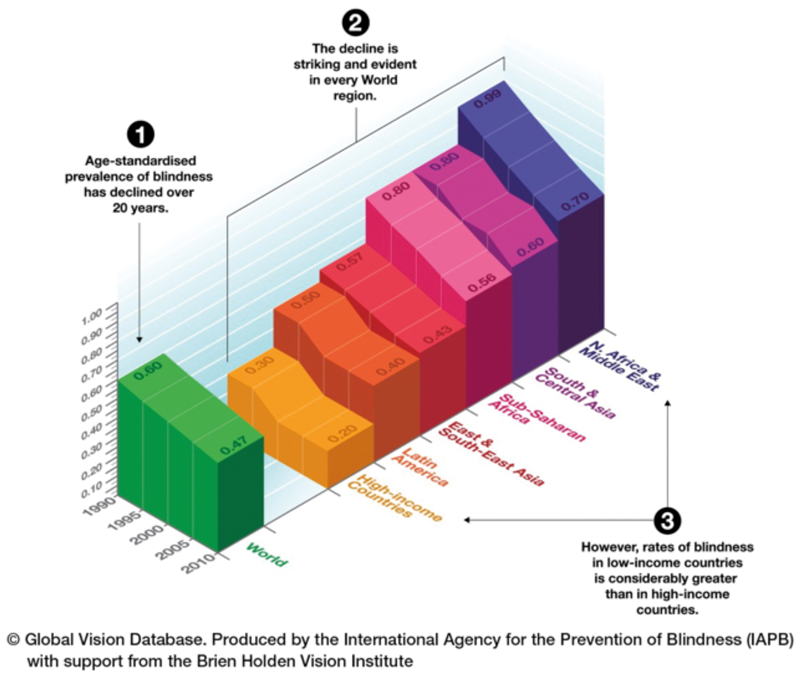
Figure 2: Age-standardised prevalence rates of blindness for all ages over time for the world and for regions.
The age-standardised prevalence of blindness and vision impairment has decreased over the last 20 years [11]
The global age-standardised prevalence of blindness among older adults decreased from 3.0% (95% CI, 2.7-3.4%) in 1990 to 1.9% (95% CI, 1.7-2.2%) in 2010, a decrease of 0.5% (95% CI, 0.4-0.8%) per decade (represented for all ages in Figure 2). During the same period, the global age-standardised prevalence of MSVI among older adults decreased from 14.3% (95% CI, 12.1-16.2%) to 10.4% (95% CI, 9.5-12.3%), a decrease of 2.0% (95% CI, 0.4-2.8%) per decade. This statistically significant decline in prevalence was also seen in all regions.
Because of increases in the proportion of older adults in the world population, the overall prevalence of blindness and MSVI has decreased less than adult age-standardised prevalences.
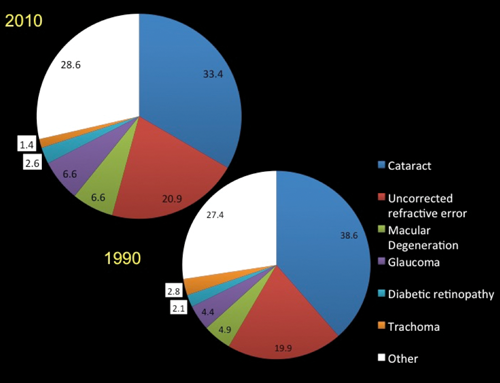
Figure 3: The contribution of various causes to the blindness burden in 2010 and 1990.
Causes of blindness and vision impairment and the change over the past 20 years [16]
The major causes of blindness in 2010 and 1990 were, in order of significance, cataract, uncorrected refractive error and macular degeneration. For MSVI, these were uncorrected refractive error, cataract and macular degeneration (Figure 3). Avoidable vision loss due to preventable or treatable causes can be defined as any vision loss due to cataract, uncorrected refractive error, trachoma, glaucoma and diabetic retinopathy. With this definition, of the 31.8 million people blind in 1990, 68% (95% uncertainty interval, UI: 65–70) had preventable or treatable causes. By 2010, the proportion had decreased to 65% (61–68) of 32.4 million blind, which was a significant change.
The proportions of vision impairment caused by cataract and trachoma decreased in the study period of 20 years. Those for glaucoma, macular degeneration, and diabetic retinopathy increased; and that for uncorrected refractive error changed little.
Conclusions and impact
Prevalence of blindness and vision impairment over the past 20 years – both globally and in every region – is declining. This is powerful evidence that the fight to eliminate avoidable blindness and vision impairment is being won.
This international collaboration of 79 leading ophthalmic epidemiologists from around the world, carried out in partnership with the WHO, has compiled the most up-to-date statistics ever generated on the prevalence of global blindness. This has facilitated the analysis of trends and risk factors.
The richness and detail of the VLEG’s Global Vision Database data enables its users (government policymakers, nongovernmental organisations including healthcare providers and charities, researchers and educators) in countries worldwide to obtain location relevant estimates. Where countries lack their own data, the model uses data from both published and unpublished sources in the region, applied to the specific population demographic of that country. This provides a more accurate view of the specific issues faced by each country which, due to differing risk factors, may differ markedly from their neighbours.
VLEG findings were used in the global analyses of eye-health economics carried out by PricewaterhouseCoopers’s economic reports ‘Price of Sight’ and ‘Investing in Vision’ (Feb 2013) [17]. This economic report calculates the costs and benefits of achieving the IAPB’s VISION 2020 goal of eliminating avoidable blindness by the year 2020.
The findings have directly impacted on healthcare policymakers (e.g. International Agency for the Prevention of Blindness Global Assembly [18]; American Public Health Association (APHA) Vision Care Section Outstanding Scientific Paper (Project) award for 2014) and professionals, charities and economic analysts, both in the UK and overseas, increasing their awareness of global eye care issues.
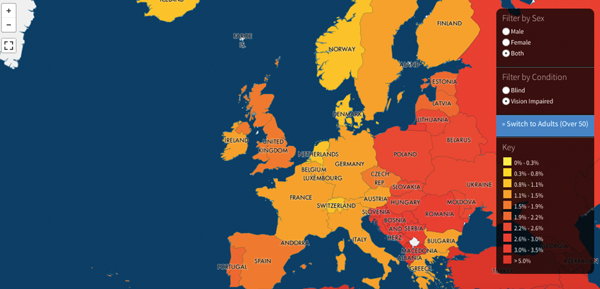
Figure 4: Screenshot of the visualisation online tool, allowing any internet user to determine prevalence of blindness and vision impairment by gender and by country (www.iapb.org/maps).
Accessing this data and future work
- Launched on World Sight Day 2014, interactive maps provide visualisation of the prevalence of blindness and visual impairment by country and region, by sex, and by ‘time-lapse’ from 1995-2010, available by visiting www.iapb.org/maps (Figure 4).
- Reflecting the perceived importance of the work and to promote its wide dissemination, the Brien Holden Vision Institute Foundation (Australia) has funded the ongoing maintenance of this database with new estimates expected at the beginning of 2016.
- We are currently completing a review of the methodological quality of the included GBD studies against the STROBE Guidelines [19]. This review will inform the development of consensus guidelines for future population-based surveys of eye disease and vision loss. The first meeting on this subject will take place at the World Ophthalmology Congress in 2016.
References
1. Global Vision Database.
www.globalvisiondata.org
Last accessed September 2015.
2. Universal eye health: a global action plan 2014–2019. World Health Organization.
www.who.int/blindness/
Last accessed September 2015.
3. Epidemiology of eye disease / Global Burden of Disease study. Anglia Ruskin University.
http://www.anglia.ac.uk/ruskin/en/
home/microsites/veru/other_research_areas/
global_burden_of_diseases.html
Last accessed September 2015.
4. Global Burden of Disease (GBD). Institute for Health metrics and Evaluation.
www.healthdata.org/gbd
Last accessed September 2015.
5. Bourne R, Price H, Taylor H, et al. New Systematic Review Methodology for Visual Impairment and Blindness for the 2010 Global Burden of Disease Study. Ophth Epidemiol 2013;20(1):33-9.
6. Hornby SJ, Adolph S, Gothwal VK, et al. Evaluation of children in six blind schools of Andhra Pradesh. Indian J Ophthalmol 2000;48:195-200.
7. Rahi JS, Cumberland PM, Peckham CS. British Childhood Visual Impairment Interest Group. Improving detection of blindness in childhood: the British Childhood Vision Impairment Study. Pediatrics 2010;126:e895-903.
8. RAAB Repository.
http://www.raabdata.info
Last accessed September 2015.
9. Arieta CE, de Oliveira DF, Lupinacci AP, et al. Cataract remains an important cause of blindness in Campinas, Brazil. Ophthalmic Epidemiol 2009;16:58-63.
10. Limburg H, Silva JC, Foster A. Cataract in Latin America: findings from nine recent surveys. Rev Panam Salud Publica 2009;25:449-55.
11. Stevens G, White R, Flaxman SR, et al. Global prevalence of visual impairment and blindness: magnitude and temporal trends, 1990-2010. Ophthalmology 2013;120(12):2377-84.
12. Nirmalan PK, Krishnaiah S, Shamanna BR, et al. A population-based assessment of presbyopia in the state of Andhra Pradesh, south India: the Andhra Pradesh Eye Disease Study. Invest Ophthalmol Vis Sci 2006;47(6):2324-8.
13. Burke AG, Patel I, Munoz B, et al. Population-based study of presbyopia in rural Tanzania. Ophthalmology 2006;113(5):723-7.
14. Ramke J, du Toit R, Palagyi A, Brian G, Naduvilath T. Correction of refractive error and presbyopia in Timor-Leste. Br J Ophthal 2007;91(7):860-6.
15. Sherwin JC, Keeffe JE, Kuper H, et al. Functional presbyopia in a rural Kenyan population: the unmet presbyopic need. J Clin Exp Ophthalmol 2008;36(3):245-51.
16. Bourne RR, Stevens GA, White RA, et al; on behalf of the Vision Loss Expert Group. Causes of vision loss worldwide, 1990-2010: a systematic analysis. Lancet Glob Health 2013;1(6):e339-49.
17. Investing In Vision: The Costs and Benefits of Ending Avoidable Blindness. The Fred Hollows Foundation.
http://www.hollows.org.au/our-work/
research-innovation/investing-vision-reports
Last accessed September 2015.
18. Taylor K (2012). International Agency of the Prevention of Blindness (IAPB). Briefing Paper: The Global Burden of Disease (GBD) 2010 Study.
http://www.iapb.org/sites/iapb.org/files/
IAPB%20position%20on%20GBD%20data.pdf
Last accessed September 2015.
19. von Elm E, Altman DG, Egger M, et al; STROBE Initiative. The Strengthening the Reporting of Observational Studies in Epidemiology (STROBE) statement: guidelines for reporting observational studies. Lancet 2007;370(9596):1453-7.
Further reading
-
WHO: Universal Eye Health: Global Action Plan www.who.int/blindness/
-
Global Vision Database: www.globalvisiondata.org
-
Stevens G, White R, Flaxman SR, et al. Global prevalence of visual impairment and blindness: magnitude and temporal trends, 1990-2010. Ophthalmology 2013;120(12):2377-84.
-
Bourne RR, Stevens GA, White RA, et al; on behalf of the Vision Loss Expert Group. Causes of vision loss worldwide, 1990-2010: a systematic analysis. Lancet Glob Health 2013;1(6):e339-49. Open Access.
-
Seven papers specific to cause-specific vision loss prevalence of each world region were published in the Br J Ophthalmol in 2013 and 2014.
TAKE HOME MESSAGE
-
Global Vision Database estimates show how the total number of blind and vision impaired persons has changed over a period of 20 years from 1990 – something that was not possible until now.
-
Blindness and vision impairment rates are in decline in every world region; improvements to public health and eye care service delivery played a key role in this success.
-
Sustained and collaborative efforts are needed to continue these positive trends.
-
Challenges include the ‘gap’ between low- and high-income countries.
Declaration of Competing Interests: None declared.
COMMENTS ARE WELCOME