From multiple sclerosis to raised intracranial pressure, optical coherence tomography is transforming how we diagnose, monitor and predict outcomes across the full spectrum of neuro-ophthalmic disease.
Optical coherence tomography (OCT) is a rapid imaging method that utilises light waves to produce cross-sectional images of the retina and optic nerve head (ONH). Many will have encountered OCT in medical retina and glaucoma clinics, but its use is growing rapidly in neuro-ophthalmology.
The key principle behind this is that the retina is essentially an extension of the brain. Damage anywhere along the visual pathway, from the optic nerve to the occipital cortex, leaves a measurable footprint in the layers of the retina.
The two main measurements discussed in this article are taken from different regions of the retina. The peripapillary region is the area surrounding the optic disc. This is the point where all retinal nerve fibres converge and exit the eye on the way to the brain. This layer is called the peripapillary retinal nerve fibre layer (pRNFL), and its thickness gives an indication of the health of the axons; the thinner the layer, the fewer the axons. It is particularly useful in quantifying optic disc swelling and monitoring change over time. The normal global average for pRNFL thickness is 105μm, with it declining by 0.017% per year from age 18 [2]. The superior-temporal and inferior-temporal sections of the pRNFL are thickest due to the convergence of the arcuate nerve fibre bundles. Figure 1 shows the thickness values of the different sections of the optic disc.
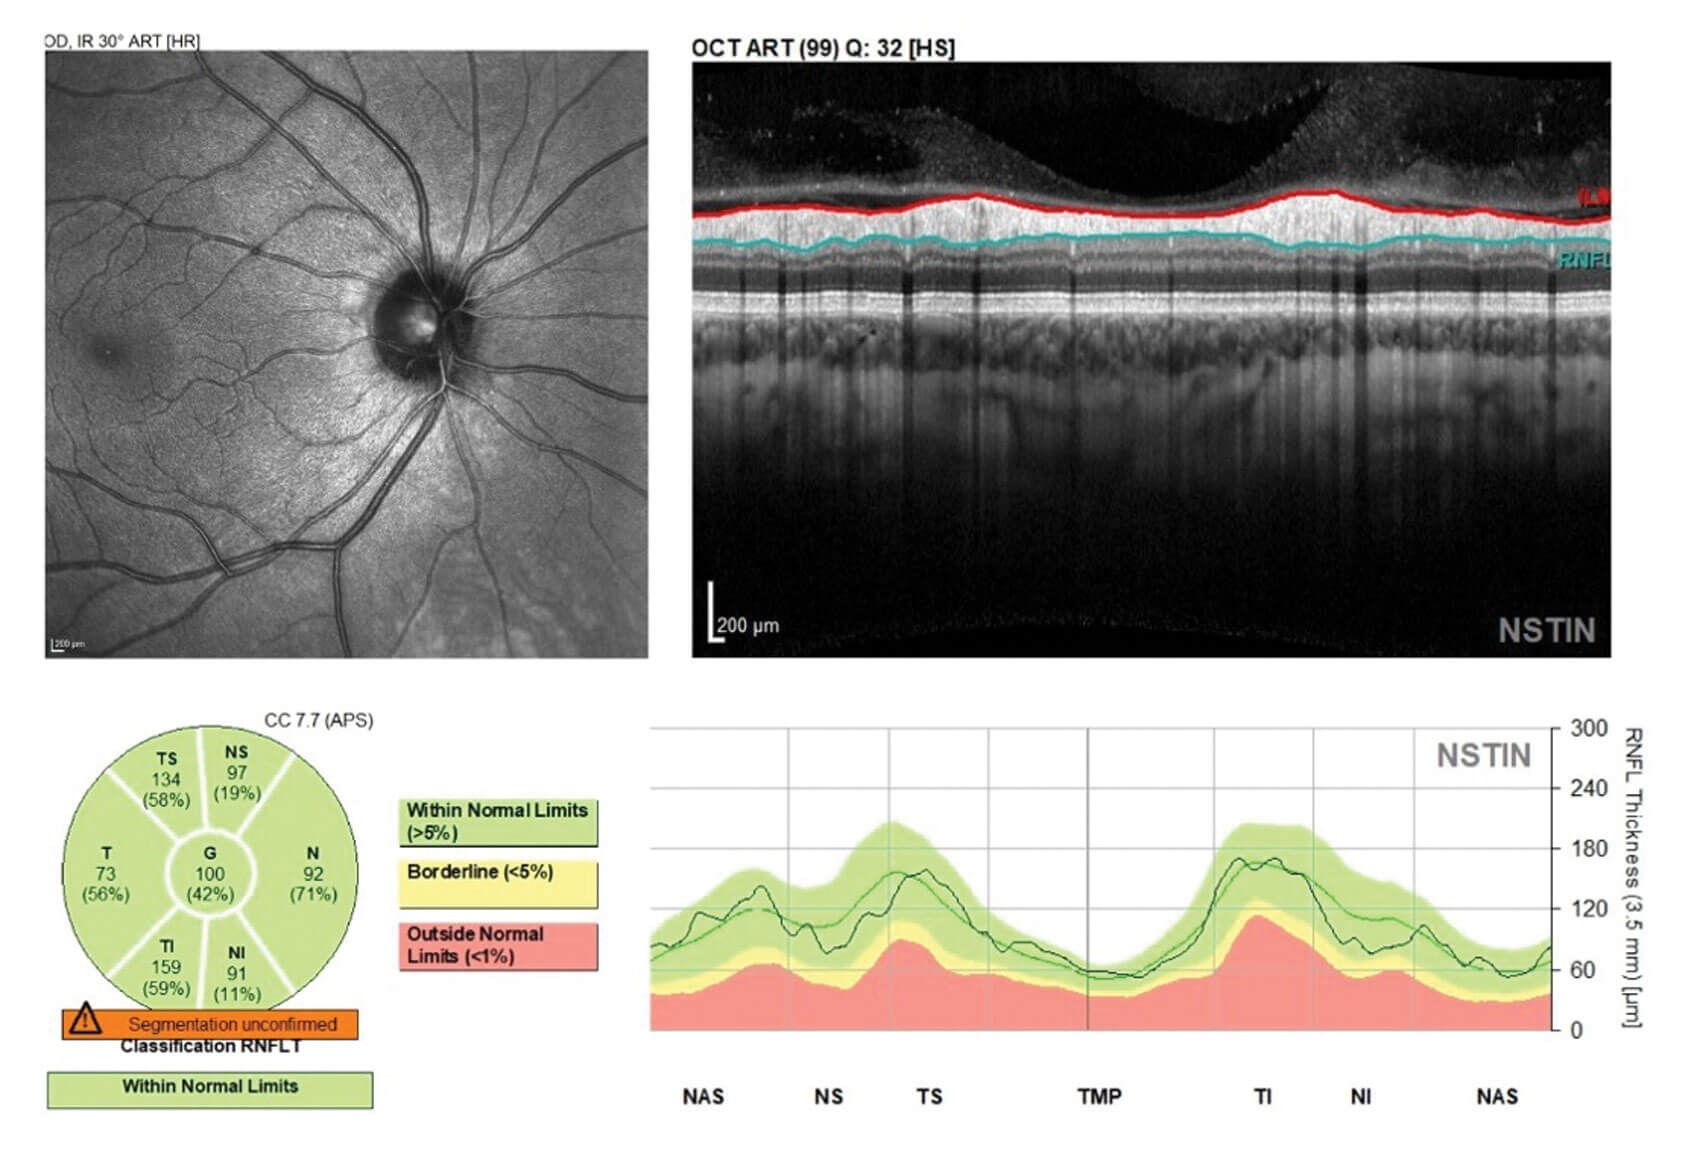
Figure 1: OCT of the peripapillary retinal nerve fibre layer.
The macula is the central part of the retina responsible for our detailed central vision. The macular ganglion cell-inner plexiform layer (mGCIPL) contains the nerve cell bodies, and the thickness shows the level of neuronal loss. Macular ganglion cell inner plexiform layer thickness typically ranges from 70–85μm, though each device uses its own database to flag values outside the normal range (Figure 2). Macular ganglion cell-inner plexiform layer thinning typically happens before pRNFL thinning across nearly all neuro-ophthalmic conditions and correlates better with the degree of visual loss [1,3]. For this reason, it is the most sensitive marker of irreversible damage.
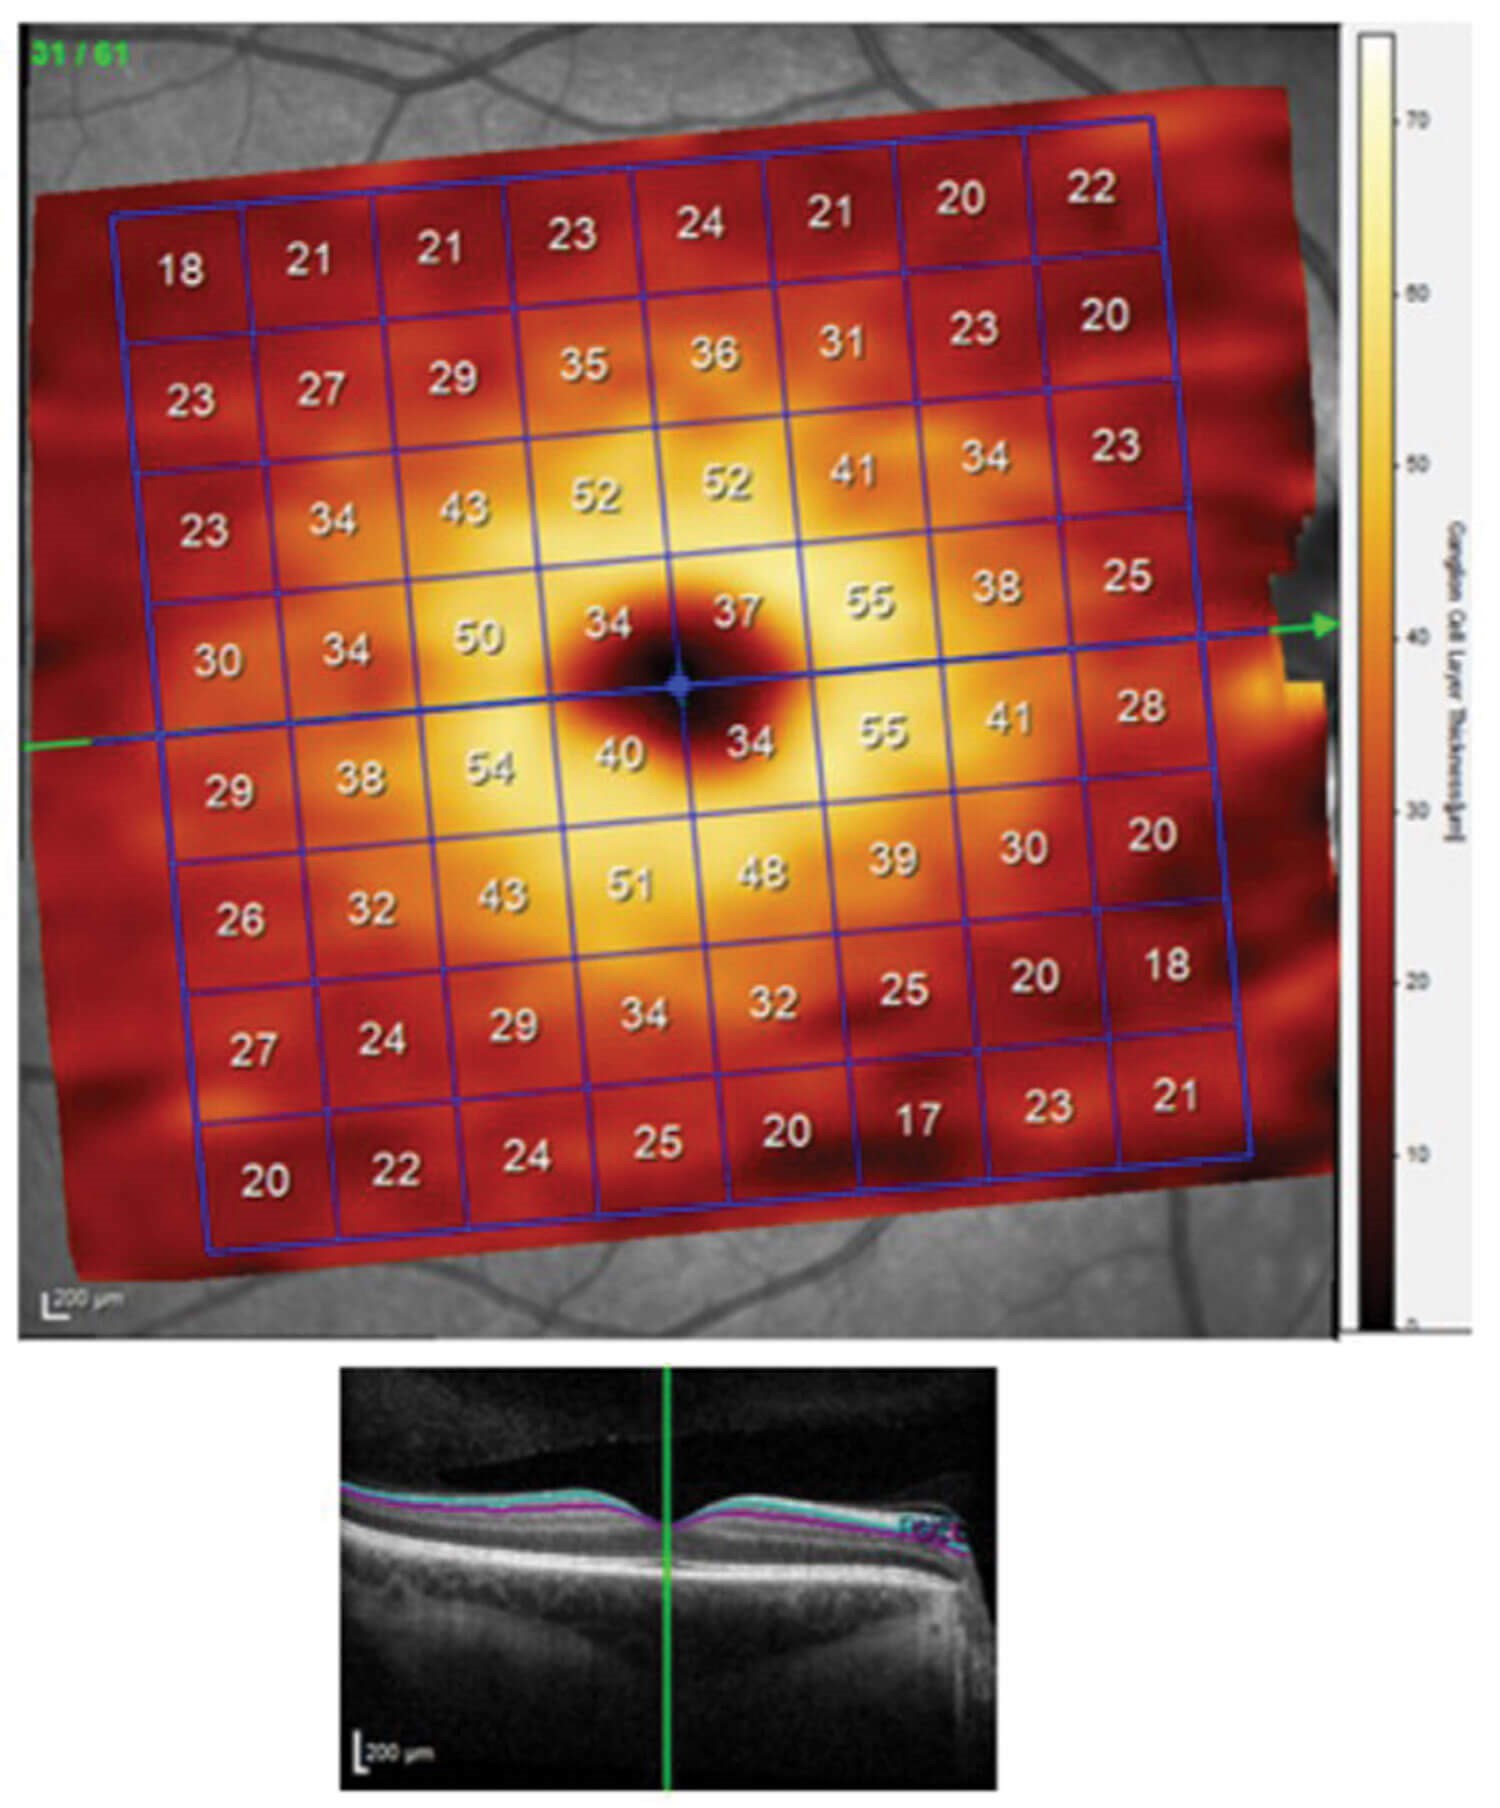
Figure 2: Heat map of the macular ganglion cell layer showing regional thickness values (μm).
OCT software also provides ganglion cell maps including the Heidelberg Glaucoma Module Premium Edition (GMPE) and the Zeiss Cirrus Ganglion Cell Analysis (GCA). This includes en face OCT which allows visualisation of the pattern of ganglion cell loss. This is particularly useful for localising a lesion along the visual pathway.
Why use both?
These two measurements should always be interpreted together and understanding why is important. The two measurements look at different parts of the neurone at different points in time. In acute disease, pRNFL can be misleadingly elevated due to disc swelling, whilst mGCIPL can begin to thin as ganglion cells die.
At the other end of the timeline, in very late-stage chronic disease the pRNFL plateaus at roughly 30μm, even if the nerve continues to worsen. This is known as the OCT floor effect. Macular ganglion cell-inner plexiform layer thickness will continue to fall and remains useful in severe, chronic diseases.
Finally, interpreting pRNFL on its own is ambiguous. Does a falling pRNFL mean resolving disc swelling or are nerve fibres being lost irreversibly? A preserved mGCIPL alongside a falling pRNFL points towards resolving swelling; whereas progressive concurrent thinning points towards optic neuropathy. With mGCIPL we can put context to the pRNFL value and trend.
Multiple sclerosis and demyelinating optic neuritis
Multiple sclerosis (MS) is a chronic immune-mediated demyelinating disease of the central nervous system. Multiple sclerosis-related optic neuritis (MSON) is a common manifestation, where inflammation of the optic nerve causes acute visual loss, pain on eye movement and colour desaturation.
Optical coherence tomography was first applied in neuro-ophthalmology in 1999, demonstrating pRNFL thinning in MS patients with a history of optic neuritis [4]. In acute MSON, elevated pRNFL measurements quantify ONH swelling even where disc oedema is not clinically apparent, with temporal pRNFL thinning becoming predominant by three months [5, 6]. Macular ganglion cell-inner plexiform layer thinning occurs earlier (within about two weeks) providing a sensitive early marker of permanent retinal ganglion cell loss, while pRNFL remains high [7]. It also correlates better than pRNFL with visual dysfunction, quality of life, disability and MRI findings [8,9].
Interestingly, thinning of both layers can happen in MS patients who have never had an acute episode of optic neuritis, and OCT could have a role as a biomarker of MS disease activity, and possibly one day may reduce the need for frequent MRIs [10,11].
Optic disc drusen
Optic disc drusen (ODD) are deposits within the ONH that may become calcified over time. These can be tricky to differentiate from true disc swelling. Enhanced-depth imaging OCT (EDI-OCT) penetrates deeper into the ONH than standard OCT, giving a much clearer picture of deeper ONH structures that would otherwise be missed. It detects ODD more reliably than B-scan ultrasound and is now the investigation of choice. Optic disc drusen appear on EDI-OCT as hyporeflective structures above the lamina cribrosa with a bright hyperreflective margin [12,13].
Optic disc drusen can be split into calcified and non-calcified drusen, depending on the stage of development. B-scan ultrasound is only able to identify calcified drusen and gives no indication on ONH health. The resolution of B-scan also makes it unreliable to accurately measure ODD over time. Because EDI-OCT is a platform on top of OCT, it can also be used to quantify the impact of ODD on the optic nerve at the same time. Enhanced-depth imaging-OCT can therefore offer prognostic information that B-scan cannot [14].
PHOMS
Peripapillary hyperreflective ovoid mass-like structures (PHOMS) are distinct from ODD but are often confused with ODD. On OCT, they appear as hyperreflective ovoid structures without the hyporeflective core seen in ODD. They are thought to be caused by a build-up of axoplasm (cytoplasm of the axon) in swollen axons, causing them to bulge into the surrounding retina. Importantly, PHOMS can be seen in papilloedema, ODD and crowded discs alike, so their presence is not useful for distinguishing between true disc swelling and pseudopapilloedema. See Table 1 for a comparison of key features of ODD and PHOMS [13].
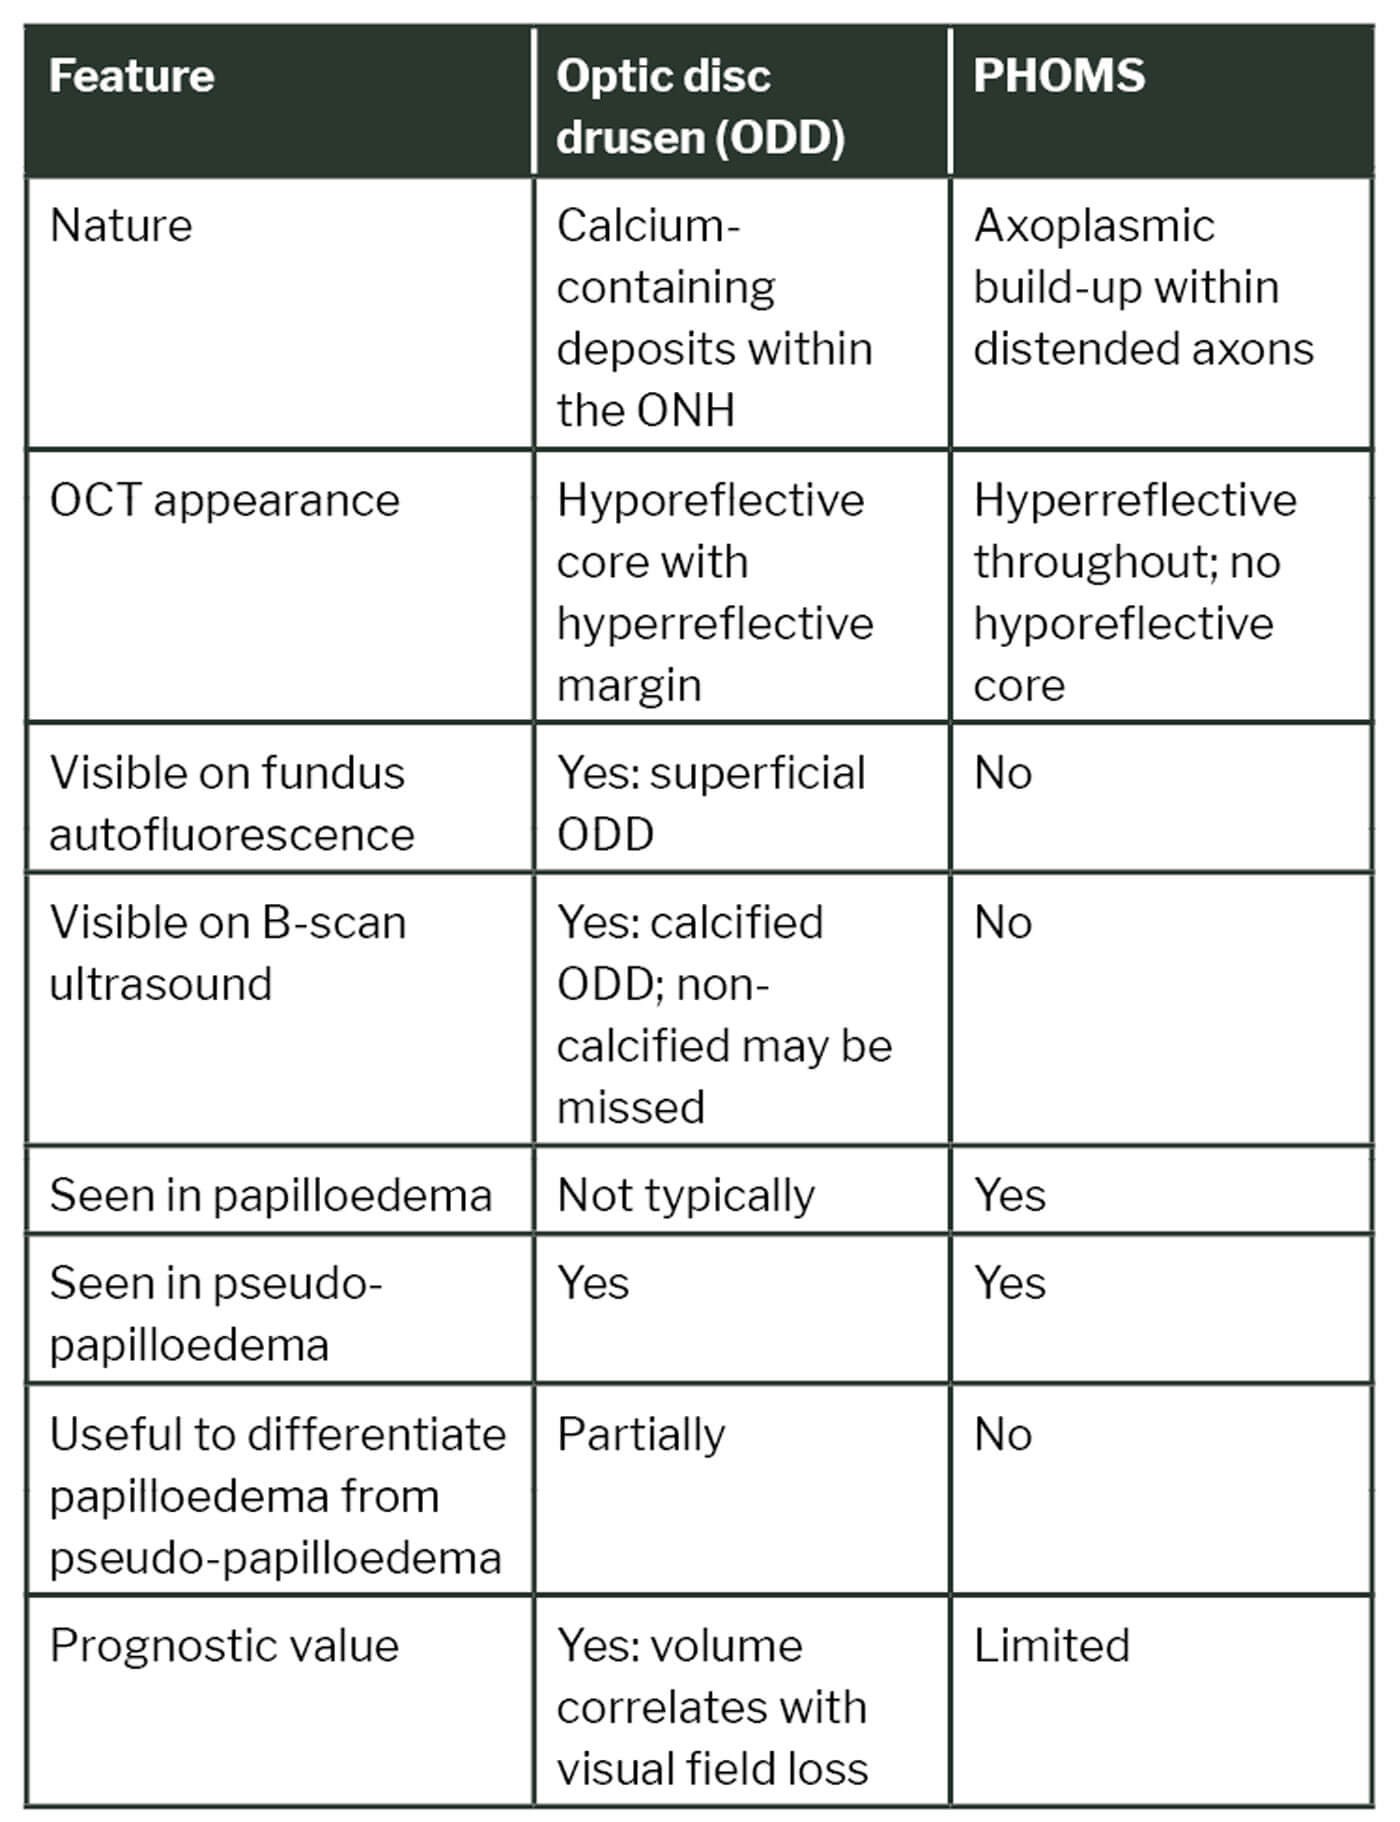
Table 1: Comparison of ODD and peripapillary hyperreflective ovoid mass-like structures (PHOMS).
Raised intracranial pressure and IIH
Raised intracranial pressure (ICP) causes optic disc swelling (papilloedema) which can lead to permanent visual loss if untreated. Idiopathic intracranial hypertension (IIH) is raised ICP without an identifiable cause, most commonly affecting women of childbearing age with obesity.
On OCT, papilloedema is associated with raised pRNFL thickness and upward deflection of the retinal pigment epithelium-Bruch’s membrane complex [1]. Serial pRNFL measurements offer more objective monitoring of disc swelling than subjective Frisén grading [15]. Importantly, a falling pRNFL can represent either treatment success or progressive atrophic optic neuropathy, so like the other conditions mentioned, mGCIPL measurements distinguish between the two. Preserved mGCIPL with reducing pRNFL suggests genuine treatment response; thinning of both indicates worsening optic neuropathy [1].
NMOSD
Neuromyelitis optica spectrum disorder (NMOSD) is an autoimmune disease affecting the optic nerves and spinal cord which is associated with the AǪP4-IgG or MOG-IgG antibodies.
Producing more severe pRNFL and mGCIPL thinning than MSON, NMOSD classically affects the superior and inferior quadrants rather than the temporal quadrant seen in MS [16]. Damage is predominantly attack-driven, however MOG-IgG positive patients behave more like MS, with progressive deterioration between attacks, whereas AǪP4-IgG positive patients sustain damage only during attacks [17]. Additionally, microcystic changes (small fluid-filled cysts in the inner nuclear layer) in the macula occur more commonly in NMOSD than in MS (20–26% in NMOSD vs 1–5% in MS) and likely represents more severe optic nerve damage [16,18]. These are thought to arise from retrograde degeneration, where damage to the optic nerve axons travels in the reverse direction to the ganglion cells bodies of the macula, resulting in cell death.
Anterior ischaemic optic neuropathy
Anterior ischaemic optic neuropathy (AION) is infarction of the anterior optic nerve causing acute painless visual loss, classified as arteritic (most commonly due to giant cell arteritis) or non-arteritic AION (commonly associated with vascular risk factors).
Macular ganglion cell-inner plexiform layer thinning begins first within days of onset, followed by pRNFL change. Optical coherence tomography helps distinguish non-arteritic AION from branch retinal artery occlusion (BRAO). In BRAO, thinning of the entire inner retina including the inner nuclear layer occurs, whereas in non-arteritic AION, only the pRNFL and mGCIPL are affected. This is an important distinction, as retinal artery occlusions require thromboembolic investigation that non-arteritic AION does not [1].
Compressive optic neuropathy
Compressive optic neuropathy occurs when a structural lesion like a pituitary adenoma, meningioma or thyroid eye disease compresses the optic nerve or chiasm. Early detection is important as visual loss may be reversible with prompt decompression.
Macular ganglion cell-inner plexiform layer thinning may precede both pRNFL change and perimetric loss [19,20]. The pattern of loss helps localise pathology, with binasal mGCIPL loss suggesting chiasmal compression, and homonymous thinning pointing towards optic tract pathology. These findings are particularly obvious with en face ganglion cell maps (GMPE/GCA). Additionally, preoperative OCT measurements help predict likelihood of visual recovery, with greater thinning associated with poorer outcomes.
OCT angiography
Optical coherence tomography angiography (OCTA) is a dye-free technique imaging retinal and ONH vasculature by detecting red blood cell movement. It has demonstrated reduced peripapillary perfusion across demyelinating, ischaemic and hereditary optic neuropathies, though its clinical role is still evolving and reliability is currently limited in the presence of disc swelling.[1]
References
1. Minakaran N, de Carvalho ER, Petzold A, Wong SH. Optical coherence tomography (OCT) in neuro-ophthalmology. Eye (Lond) 2021;35(1):17–32.
2. Kanamori A, Escano MF, Eno A, et al. Evaluation of the effect of aging on retinal nerve fiber layer thickness measured by optical coherence tomography. Ophthalmologica 2003;217(4):273–8.
3. Ye C, Lam DS, Leung CK. Investigation of floor effect for OCT RNFL measurement. Invest Ophthalmol Vis Sci 2011;52:176.
4. Parisi V, Manni G, Spadaro M, et al. Correlation between morphological and functional retinal impairment in multiple sclerosis patients. Invest Ophthalmol Vis Sci 1999;40(11):2520–7.
5. Kupersmith MJ, Mandel G, Anderson S, et al. Baseline, one and three month changes in the peripapillary retinal nerve fiber layer in acute optic neuritis. J Neurol Sci 2011;308(1–2):117–23.
6. Costello FE, Klistorner A, Kardon R. Optical coherence tomography in the diagnosis and management of optic neuritis and multiple sclerosis. Ophthalmic Surg Lasers Imaging 2011;42:S28–40.
7. Kupersmith MJ, Garvin MK, Wang JK, et al. Retinal ganglion cell layer thinning within one month of presentation for optic neuritis. Mult Scler 2016;22(5):641–8.
8. Walter SD, Ishikawa H, Galetta KM, et al. Ganglion cell loss in relation to visual disability in multiple sclerosis. Ophthalmology 2012;119(6):1250–7.
9. Saidha S, Syc SB, Durbin MK, et al. Visual dysfunction in multiple sclerosis correlates better with optical coherence tomography derived estimates of macular ganglion cell layer thickness than peripapillary retinal nerve fiber layer thickness. Mult Scler 2011;17(12):1449–63.
10. Petzold A, Balcer LJ, Calabresi PA, et al. Retinal layer segmentation in multiple sclerosis: a systematic review and meta-analysis. Lancet Neurol 2017;16(10):797–812.
11. Saidha S, Al-Louzi O, Ratchford JN, et al. Optical coherence tomography reflects brain atrophy in multiple sclerosis: a four-year study. Ann Neurol 2015;78(5):801–13.
12. Merchant KY, Su D, Park SC, et al. Enhanced depth imaging optical coherence tomography of optic nerve head drusen. Ophthalmology 2013;120(7):1409–14.
13. Malmqvist L, Bursztyn L, Costello F, et al. The optic disc drusen studies consortium recommendations for diagnosis of optic disc drusen using optical coherence tomography. J Neuroophthalmol 2018;38(3):299–307.
14. Traber GL, Weber KP, Sabah M, et al. Enhanced depth imaging optical coherence tomography of optic nerve head drusen: a comparison of cases with and without visual field loss. Ophthalmology 2017;124(1):66–73.
15. Scott CJ, Kardon RH, Lee AG, et al. Diagnosis and grading of papilledema in patients with raised intracranial pressure using optical coherence tomography vs clinical expert assessment using a clinical staging scale. Arch Ophthalmol 2010;128(6):705–11.
16. Bennett JL, de Seze J, Lana-Peixoto M, et al. Neuromyelitis optica and multiple sclerosis: seeing differences through optical coherence tomography. Mult Scler 2015;21(6):678–88.
17. Oertel FC, Outteryck O, Knier B, et al. Optical coherence tomography in myelin oligodendrocyte-glycoprotein antibody-seropositive patients: a longitudinal study. J Neuroinflammation 2019;16:154.
18. Schneider E, Zimmermann H, Oberwahrenbrock T, et al. Optical coherence tomography reveals distinct patterns of retinal damage in neuromyelitis optica and multiple sclerosis. PLoS ONE 2013;8(6):e66151.
19. Zhang Y, Ye Z, Wang M, Ǫiao N. Ganglion cell complex loss precedes retinal nerve fiber layer thinning in patients with pituitary adenoma. J Clin Neurosci 2017;43:274–7.
20. Tieger MG, Hedges TR, Ho J, et al. Ganglion cell complex loss in chiasmal compression by brain tumours. J Neuroophthalmol 2017;37(1):7–12.
Declaration of competing interests: None declared.