David Huang first described optical coherence tomography (OCT) in 1991, in his seminal paper on the subject in Science. This method developed the work of others on ophthalmic interferometry, which essentially showed that measuring reflected light could be used to image the eye [1-3]. Using laser light into the infrared spectrum allows imaging of the retina through into the choroid.
Increasing speeds of computer processing, faster methods of scanning from time domain to fourier domain, and advances such as swept source OCT, enhanced depth imaging OCT and OCT angiography has enhanced what is possible. Demand has been driven with the development of treatments that require careful assessment of ocular structures, in particular assessment of macular fluid on OCT, which guides use of anti-VEGF injections and treatment regimes. This review will provide a brief history of OCT to mark 25 years since its invention providing an update on what is possible with OCT now and how that can complement clinical practice.
History
Optical coherence tomography works in an analogous way to using ultrasound waves, however, as light waves are at too high velocity to be measured, the use of an interferometer allows image detection. For time domain OCT (TD-OCT) the interferometer has a reference arm with a mirror and sample arm, which detects the light echo from the retina. The reference arm has a mirror, which moves mechanically to vary time delay and measure interference. The measurement of back scattered light from the sample arm and reference light from the reference arm together creates an interference pattern, because light from both arms has travelled a similar distance. This creates a reflectivity profile or A-scan, which when several A-scan images are combined create a B-scan for review [1-4]. Although this imaging modality has constraints in terms of speed of acquisition and resolution of images, when it was developed it represented a major step forward in ophthalmological imaging.
“In many cases the presence of a choroidal neovascular membrane can be seen on an OCT and so increasingly FFAs are not done.”
There was a technological leap forward over a decade after the creation of OCT, when fourier domain OCT (FD-OCT) was invented with a subset known as spectral domain OCT (SD-OCT). SD-OCT works through light echo interference patterns being detected as a function of the wavelength (by fourier transformation), by an interferometer and a stationary reference arm [1-5]. There is a broadband source and the spectral interference pattern is dispersed by a spectrometer and collected at the same time on an array detector [5]. This technology has allowed much faster imaging as compared to TD-OCT with better resolution.
Zeiss was the first company to commercialise and develop OCT with the OCT1 in 1997. Widespread use, with an easy to use system for imaging the retina, began in 2002 with the Stratus (OCT3) and the anterior segment in 2006 with the Zeiss Visante. The latest imaging systems from Zeiss include the Zeiss Cirrus 5000 OCTA (OCT angiography). This uses OCT to image the retinal circulation by imaging blood flow and extracting that information to show a picture of the retinal circulation. This enables the superficial and deep capillary plexae to be seen as well as choroidal neovascularisation and some details of the choroid.
The latest Zeiss IOL master 700 biometry system uses swept source OCT to image the whole eye, improving the accuracy of measurements as it allows fixation to be assessed, abnormalities in lens position to be detected and can get through a larger range of cataract.
Many companies are now involved including Topcon, Heidelberg, Nidek, Optovue, Canon and Optos and the OCT system may have additional imaging and functional testing modalities such as colour or multi-colour imaging, auto fluorescence, fundus fluorescien angiography (FFA), indocyanine green (ICG) and microperimetry. Some use autofocus, increasing the ease of acquisition, while some have eye tracking, which enhances repeatability and resolution.
Medical retina
With the introduction of the Stratus OCT it soon became apparent that OCT was more accurate than clinical biomicroscopy at detecting retinal and subretinal fluid and it became used extensively for macular assessments in clinic, in screening and in ‘virtual clinics’ [6]. The Stratus (a TD-OCT) allowed resolution of the retinal architecture down to about 10 microns. With the advent of SD-OCT devices such as the Spectralis (Heidelberg) or Cirrus (Zeiss) OCT and more recently swept source technology, such as in the Topcon Atlantis, finer detail of the retinal architecture as well as of the posterior vitreous and choroid can be visualised [4]. These machines have allowed for quantitative assessment of macular oedema, with numerical assessment of the central foveal subfield, the four inner and outer subfields, as well as the macular volume. This has become the gold standard of measurement for various retinal pathologies causing macular oedema or retinal thickening. There is variation between the stratus (TD-OCT) and SD-OCTs, as well as between different SD-OCTs, in terms of the algorithmic measurement of the central macular thickness. Therefore, different numerical values are obtained depending on the machine used.
OCT shows the structure, not the activity of the lesion, but often these are synonymous. As most current macular treatments aim to resolve oedema, OCT is used as the mainstay for monitoring the effect of treatment. FFA will show if there is leak and so can complement OCT findings. In some cases ‘fluid’ can be seen on OCT but there is no leak on FFA, for example in cases of central serous retinopathy (CSR), where there may be a time lag between the leak stopping and the subretinal fluid resolving. Current guidelines for macular degeneration recommend FFA before commencing anti-VEGF treatment. However, in many cases the presence of a choroidal neovascular membrane can be seen on an OCT and so increasingly FFAs are not done, especially if this might lead to a delay in treatment [7,8].

Figure 1: Wide-field EDI-OCT (OS) of patient with primary autoimmune retinopathy. Note the intraretinal cysts and enhanced view of the choroid. On Heidelberg Spectralis EDI, 55 degrees widefield, automated real time (ART) of 9.
Imaging of the choroid is becoming more accurate which is useful in diagnosing CSR, where a thickened choroid is found, and in some inflammatory conditions as a means of monitoring response to treatment [4]. This has become possible through the use of enhanced depth imaging OCT (EDI-OCT) technology, which was first described by Spaide et al. in 2008 [9]. This worked through the OCT apparatus being moved closer to the subject’s eye, creating an inverted image and with the relevant software re-orientated the image. This changed the peak sensitivity, from near the posterior vitreous as in conventional OCT, to the inner sclera. Now software correction allows this to be done automatically for EDI-OCT (Figure 1). Further developments such as the use of swept source OCT and longer wavelengths can provide a wider depth of resolution from the posterior vitreous to the choroid.

Figure 2: Comparison of OCT, OCTA and FFA of myopic choroidal neovascular membrane (CNVM) (OS). On OCT angiography module beta testing version for Heidelberg Spectralis OCT2. a) OCT showing subretinal fluid and RPE thickening; b) myopic CNVM visualised on OCTA; c) FFA at 33 seconds showing early hyperfluorescence; d) FFA at seven minutes showing increased hyperfluorescence in area of lesion.
OCT angiography (OCTA) has now become commercially available, and has been shown to detect choroidal neovascular lesions (Figure 2), especially if they are type 2 lesions in front of the retinal pigment epithelium (RPE). It works through comparing the backscatter or echo of light waves of sequential B-scans taken in the exact same position and so can create a map of blood flow [10]. There are three common methods for undertaking OCTA with SD-OCT or swept source OCT [11]. They involve measurement of the OCT signal in terms of the amplitude / intensity, phase or complex (involving both phase and amplitude). Examples of amplitude / intensity OCTA methods include speckle variance, intensity-based doppler variance, intensity-based optical microangiography (OMAG), cross-correlation mapping, and split-spectrum amplitude decorrelation angiography (SSADA). The algorithms used for these involve measuring variance, decorrelation, cross-correlation, or absolute difference of OCT signal amplitude / intensity from sequential B-scans to create a map of blood flow [11]. These methods have less of a problem with motion artefact. Comparatively phase and complex based OCTA such as phase variance, doppler variance or OMAG have to have removal of such motion artefact through software correction [11].
OCTA doesn’t show leak but may provide enough information in a non-invasive way such that the use of FFA and ICG is needed less, which could speed up treatment pathways. The measurement of the size of the neovascular network may become more important with the advent of treatments that more effectively reduce the size of neovascularisation, such as seen with anti-PDGF therapies that are in phase 3 trials.
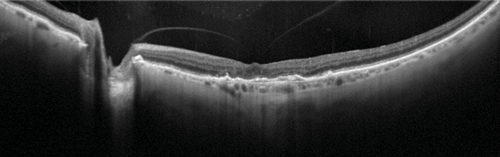
Figure 3: Widefield, high resolution OCT of vitreomacular adhesion (OS).
On Heidelberg Spectralis, 55 degrees widefield, ART of 100.
Vitreoretinal
Apart from OCT imaging having an obvious role in diagnosis of medical retinal conditions such as age-related macular degeneration (AMD), it has allowed diagnosis of various vitreoretinal conditions such as macular holes and epiretinal membranes [12]. OCT imaging can complement vitreoretinal surgery by imaging the vitreomacular interface and may be becoming increasingly useful in clinical practice. For example Steel D et al. [13] determined that the likely success of macular hole closure using ocriplasmin can be predicted from OCT measurements taken during treatment. Higher resolution wide-field OCT imaging has become possible with the use of the Topcon swept source systems and Heidelberg systems, in which details of the posterior vitreous, macular and optic disc can be seen in one image (Figure 3). Vitreoretinal surgery maybe further helped with intraoperative OCT, for example with the use of Zeiss and Optovue systems [12].
Glaucoma
OCT can be used to measure the retinal nerve fibre layer (RNFL) thickness both at the optic disc and at the macular and is increasingly used in the diagnosis and monitoring of glaucoma. This is improving due to a combination of higher resolution systems and better normative databases. RNFL thinning at the discs correlates to ganglion cell loss and implies glaucomatous optic disc changes. Different OCT machines, such as Cirrus and Spectralis OCT use different RNFL algorithms and therefore their measurements cannot be used interchangeably [14]. The development of fourier domain OCTs has allowed for more accurate RNFL measurements. Some difficulties remain with identifying the edge of the disc to measure the amount of cupping, and in deciding at which point to measure the nerve fibre layer. This has been partly corrected with improvement of algorithmic measurements of the RNFL [15]. In some systems two rings around the disc are being measured to improve the accuracy of determining nerve fibre layer thickness. Macular RNFL measurements above and below the fovea can also be used to help diagnose and monitor glaucoma.
Neuro-ophthalmology
SD-OCT is useful in neuro-ophthalmology for assessing optic nerve and visual pathway lesions. SD-OCT can measure the optic nerve head for optic disc oedema, disc asymmetry along with optic nerve head drusen through measurements of the RNFL. Swept source imaging, with its ability to penetrate deeper, may have an advantage for looking for optic disc drusen [9]. OCT can be used to objectively measure the amount of optic nerve swelling and, in some cases, distinguish papilloedema from a ‘crowded’ optic disc. Its repeatability means it can be used to monitor optic disc swelling in benign intracranial hypertension. It has become apparent that in some optic nerve conditions there are associated macular problems, either with actual macular oedema or a cystic appearance of the macula due to retrograde degeneration of nerve fibres, which can be confirmed on OCT [16].
Anterior segment
Izatt et al. were the first to show that OCT could be used to review the anterior segment and cornea [17]. There are different systems available, with some dedicated systems providing longer wavelength light sources (1310nm e.g. Zeiss Visante, Heidelberg SL-OCT) and retinal scanner conversions providing shorter wavelength light sources (830nm e.g. Zeiss Cirrus, Heidelberg Spectralis). Longer wavelength imaging provides deeper penetration for a better view of deeper structures, for example the scleral spur at the iridocorneal angle. Shorter wavelength imaging provides a higher axial resolution [17].
Anterior segment OCT can provide a quantitative measurement of the tear film. Conjunctival lesions such as pingueculas and pterygiums can be measured, which may help with monitoring changes post surgery. Measurements of the angle, iris and anterior chamber can be made allowing assessment of the anterior chamber angle [17,18]. Anterior segment ultrasound may still be needed to see behind a pigmented iris to explain an anterior displacement of the iris, due to pathologies such as an iris cyst or melanoma. OCT has shown some promising uses in reviewing the success of filtration blebs formed from trabeculectomy surgery [17,18].
OCT has been investigated as a useful measure for corneal pathology and for corneal refractive surgery. It allows for objective measurement of corneal pathology with related corneal thickness measurements. It can make preoperative planning and postoperative review of results easier. For example, with keratoconus and corneal ectasias OCT has been shown to be useful, alongside confocal microscopy, in measuring the maintenance of these conditions with collagen cross-linking. For refractive surgery, post LASIK ectasias can be measured and graded with the use of OCT. Assessment of the position of various keratoplasty operations may be further enhanced by intraoperative OCT [17].
Future of OCT
Ongoing developments include software enhancements, which enable better 3D rendering of ocular structures and vascular networks, with use of different laser wavelengths and polarised light. Automation of reading OCT results and predicting outcomes for patients is also being developed, with a project underway involving Google Deep Mind and Moorfields Eye Hospital, analysing a database of one million OCTs [19].
Newer laser systems are likely to enable much smaller adaptable systems with prototypes being developed. For example, binocular OCT is in development, which will not only image the ocular structures but could be used to measure visual acuity testing, pupil responses and measurements of eye movement. This may supersede many of the investigations undertaken in busy outpatient clinics, as the biggest barrier to flow of traffic in ophthalmology clinics is basic testing such as visual acuity measurments and OCT images [20].
References
1. Huang D, Swanson EA, Lin CP, et al. Optical coherence tomography. Science 1991;254(5035):1178-81.
2. Fercher AF, Mengedoht K. Werner W. Eye-length measurement by interferometry with partially coherent light. Optics Letters 1988;13(3):186-8.
3. Fercher AF. Ophthalmic interferometry. Proceedings of the International Conference on Optics in Life Sciences Germany 1990.
4. Murthy RK, Haji S, Sambhav K. Clinical applications of spectral domain optical coherence tomography in retinal diseases. Biomedical Journal 2016;39(2):107-20.
5. Izatt JA, Choma MA: Theory of optical coherence tomography. Optical Coherence Tomography: Technology and Applications. Heidelberg: Springer; 2008:47-72.
6. Virgili G, Menchini F, Dimastrogiovanni AF, et al. Optical coherence tomography versus stereoscopic fundus photography or biomicroscopy for diagnosing diabetic macular edema: A systematic review. Invest Ophthalmol Vis Sci 2007;48(11):4963-73.
7. Sandhu SS, Talks SJ. Correlation of optical coherence tomography, with or without additional colour fundus photography, with stereo fundus fluorescein angiography in diagnosing choroidal neovascular membranes. Br J Ophthalmol 2005;89:967-70.
8. Trichonas G, Kaiser PK. Optical coherence tomography imaging of macular oedema. Br J Ophthalmol 2014;98:24-9.
9. Silverman AL, Tatham AJ, Medeiros FA, Weinreb RN. Assessment of optic nerve head drusen using enhanced depth imaging and swept source optical coherence tomography. J Neuroophthalmol 2014;34(2):195-208.
10. De Carlo TE, Romano A, Waheed NK, Duker JS. A review of optical coherence tomography angiography. Int J Retina Vitreous 2015;1:5.
11. Liu G, Jia Y, Pechauer AD, Chandwani R, Huang D. Split-spectrum phase-gradient optical coherence tomography angiography. Biomed Opt Express 2016;7(8):2943-54.
12. Ehlers JP, Tao YK, Srivastava SK. The value of intraoperative OCT imaging in vitreoretinal surgery. Curr Opin Ophthalmol 2014;25(3):221-7.
13. Steel DHW, Parkes C, Papastavrou VT, et al. Predicting macular hole closure with ocriplasmin based on spectral domain optical coherence tomography. Eye 2016;30:740-5.
14. Wu H, De Boer JF, Chen TC. Diagnostic capability of spectral domain optical coherence tomography for glaucoma. Am J Ophthalmol 2012;153(5):815-26.
15. Mwanza JC, Budenz DL. Optical coherence tomography platforms and parameters for glaucoma diagnosis and progression. Curr Opin Ophthalmol 2016;27(2):102-10.
16. Burggraaff MC, Trieu J, de Vries-Knoppert WA, et al. The clinical specturm of macular microcystic edema. Invest Ophthalmol Vis Sci 2014;55:952-61.
17. Lim SH. Clinical applications of anterior segment optical coherence tomography. J Ophthalmol 2015; 1-12
18. Wang D, Lim S. New developments in anterior segment optical coherence tomography for glaucoma. Curr Opin Ophthalmol 2016;27(2):111-7.
19. De Fauw J, Keane P, Tomasev N, et al. Automated analysis of retinal imaging using machine learning techniques for computer vision. F1000Research 2016,5:1573.
20. Walsh AC. Binocular optical coherence tomography. Ophthalmic Surg Lasers Imaging 2011;42(4):95-105.
Take home message
-
The advent of OCT has allowed much better assessment and management of various medical and vitreoretinal disorders.
-
Since its inception for use in imaging the macula, OCT has found broader use in examination of different aspect of the anterior segment, optic nerve as well as the choroid.
-
Recent advances such as swept source OCT, enhanced depth OCT and OCT angiography have allowed for better assessment of various ocular structures and pathologies.
-
The future of OCT lies in increasingly portable hardware and automatisation of OCT interpretation.
Declaration of competing interests: None declared.
COMMENTS ARE WELCOME