Anterior segment tomography produces a three-dimensional assessment of anterior and posterior corneal structures. The Pentacam uses rotating Scheimpflug imaging to generate cross-sectional scans of the cornea and anterior chamber, essential for detecting ectasia, refractive surgery screening and longitudinal monitoring. However, the standard four-map display presents a lot of data that can be challenging to interpret.
This article outlines a systematic approach to analysing the four maps, emphasising recognition of clinically meaningful patterns and differentiation between normal and abnormal parameters, to improve diagnostic confidence and clinical decision-making.
What is the Pentacam?
The Pentacam generates a 3D model of the anterior segment from up to 25,000 elevation points, which then produces multiple maps and indices [1]. This enables quantitative analysis of both anterior and posterior corneal surfaces, corneal curvature, pachymetric distribution, anterior chamber parameters and much more. Common clinical indications for Pentacam use include [1,2]:
- Screening for corneal ectatic disorders (keratoconus, post-LASIK ectasia) by detecting early changes in curvature, elevation, thickness.
- Preoperative evaluation for corneal refractive surgery, phakic intraocular lenses (IOLs) and cataract surgery – to ensure corneal suitability, rule out ectasia risk and evaluate anterior chamber depth.
- Monitoring corneal changes over time (progression of ectasia, after cross-linking, post-surgery).
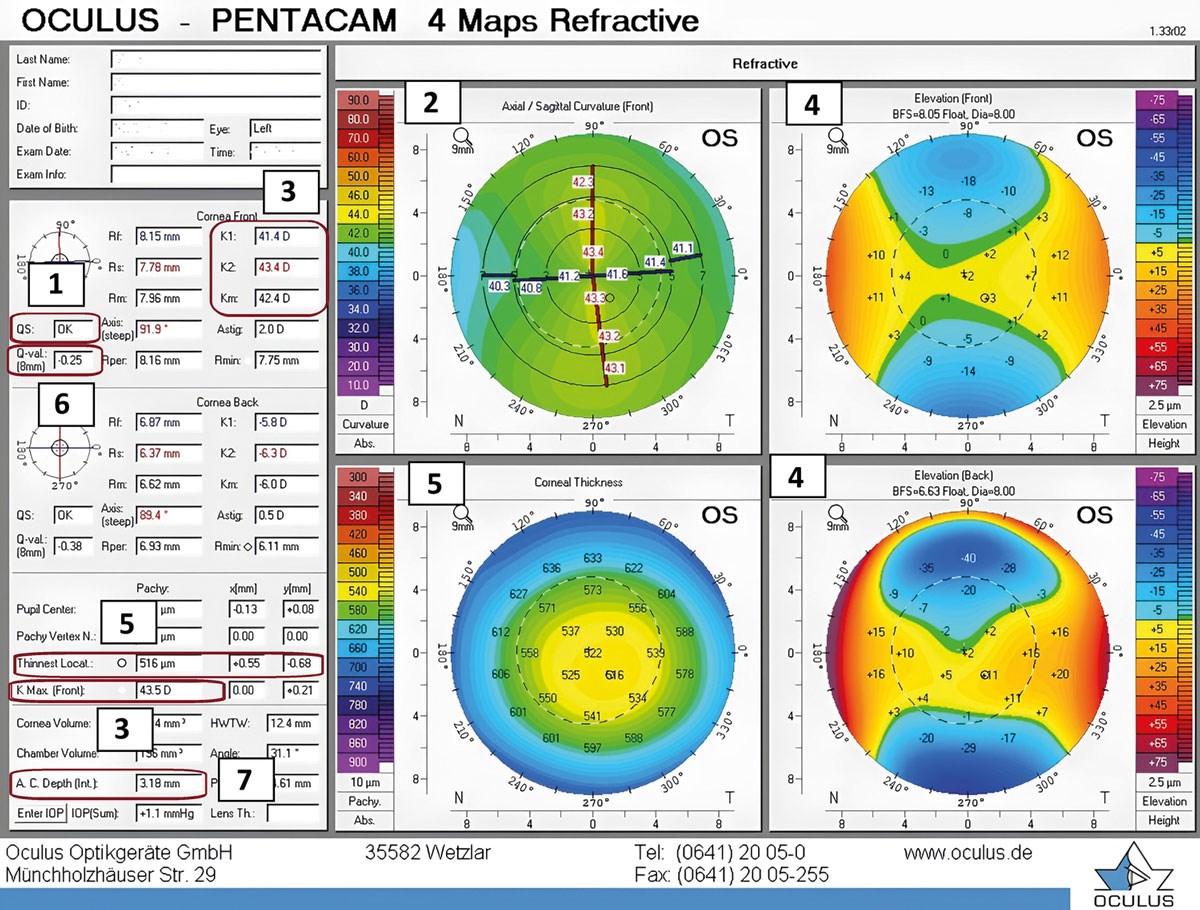
Figure 1: Four maps refractive report. Points 1–7 of the top tips are indicated on the figure. Left column of four maps report has five sections: top left: patient demographics, date and time of scan; cornea front: parameters for anterior corneal surface; back: parameters for posterior corneal surface; pachymetry (a–c): (a) pupil centre – corneal thickness at pupil centre, (b) pachy vertex n – corneal thickness at most anterior corneal point, (c) thinnest local – corneal thickness at thinnest point (each value has a corresponding symbol displayed on corneal thickness and elevation maps); anterior segment additional value.
The four-map display (Figure 1) is typically read in the following order to ensure consistent interpretation (note the maps should be set to a 9mm display with standardised scales for each map) [3]:
1. Anterior sagittal curvature map (top left)
This shows the overall shape of corneal power distribution. Warmer colours indicate steeper curvatures whilst cooler colours indicate flatter curvatures. Assess for regular vs irregular astigmatism with normal eyes showing either vertical bow tie pattern (with the rule astigmatism) or horizontal bow tie pattern (against the rule astigmatism) [2].
2. Anterior elevation map (top right)
This shows the height of the anterior corneal surface relative to a best fit sphere (BFS) or best fit toric ellipsoid (BFTE). Warm colours indicate that the cornea is elevated above the reference surface whilst cooler colours indicate the cornea is below the reference. Focus on the thinnest point area (black circle) and its associated value.
3. Posterior elevation map (bottom right)
Similar to the anterior elevation, it is elevation of the posterior corneal surface relative to BFS or BFTE. The posterior surface often shows changes earlier than anterior, for example in early keratoconus, hence, it is a key map for detecting early ectatic changes.
4. Pachymetry map (bottom left)
The spatial corneal thickness distribution is useful for screening and surgical planning. In a normal cornea the thinnest point is near the centre. Warm colours indicate thinner areas whilst cooler colours indicate thicker areas.
Ten top tips to assess a four-maps report with examples of normal vs abnormal values
1. Start with the scan quality and alignment
Confirm the scan quality is acceptable before analysing data. There should be full corneal coverage and no lids or lash interference. Quality specification (QS) will indicate the quality of the scan with white/OK indicating an acceptable scan. If the QS is flagged (yellow/red) or there are extrapolated data (black/white dots) within the central 9mm zone, the measurement may be unreliable and should be repeated [3,4].
Poor fixation, lid artefacts, blinking, tear film irregularities, recent contact lens wear and decentred scans can distort the curvature and pachymetry measurements [2]. Scans should be repeated in these situations. Patients should discontinue soft contact lenses for a minimum of one week and rigid gas-permeable lenses for at least three to four weeks prior to scanning to avoid lens-induced corneal warpage [2].
2. Understand map types: axial vs tangential
The axial (sagittal) curvature map represents average curvature which is useful for overall screening [5]. However, this can sometimes mask focal irregularity. Normal findings include a gradual flattening of 2–4D from the centre to the periphery and a symmetric bow tie pattern if regular astigmatism is present [6]. Abnormal findings include an irregular non-bow tie pattern such as butterfly or crab claw. An asymmetric bowtie, with inferior steepening, raises the suspicion of keratoconus [5].
Asymmetry between two opposite inferior and superior power values greater than 1.4D at 4mm zone on axial map is suspicious [1,4]. Inferior steepening is a potential ectasia sign.
In regular astigmatism, there is a symmetry in astigmatism axis between the superior and inferior axis. If superior and inferior axis astigmatism are skewed with a difference greater than 22° (termed skewed radial axes of astigmatism), this suggests irregular astigmatism or keratoconic asymmetry [1,4,6].
The tangential curvature map is good for detecting focal ectatic changes [5]. Look for localised steep zones, decentred steepening relative to the corneal apex and irregular astigmatism.
3. Evaluate K values and indices (data under corneal section front)
Keratometry (K) values are derived from the central 3mm zone and represent anterior corneal curvature. K1 denotes the flat meridian, while K2 represents the steep meridian; Km is the mean keratometry (average of K1 and K2). These parameters, together with astigmatic power and axis, are fundamental inputs for accurate IOL power calculations including toric IOL planning.
The average K value is approximately 43.00D. Corneas steeper than 43.00D are relatively steep; flatter than 43.00D are relatively flat. Kmax is typically <47.00D in normal corneas [2,4]; values >50.00D may indicate ectasia.
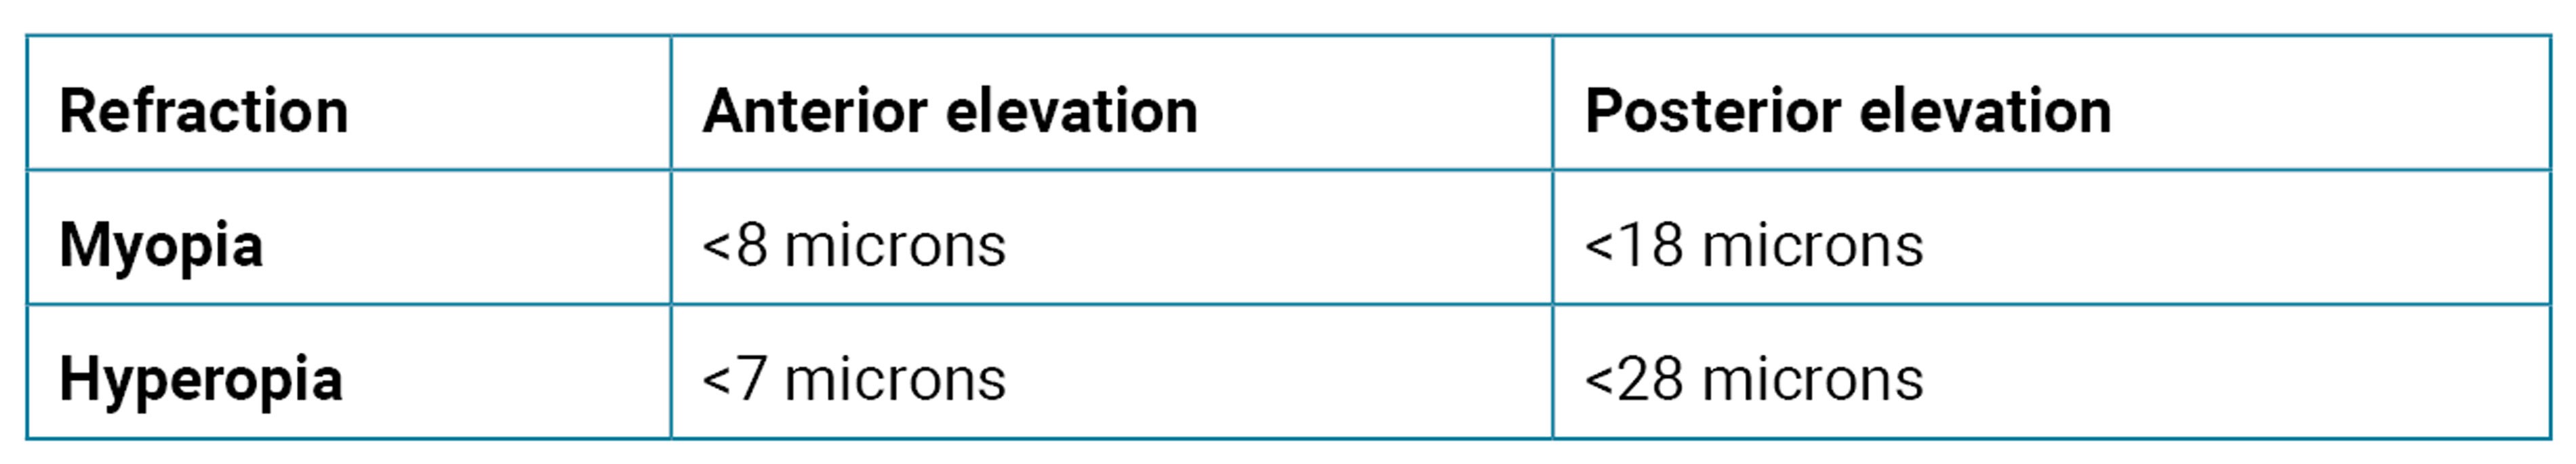
4. Interpret the elevation maps relative to a reference surface
Elevation maps should show symmetric elevation/depression. The normal shape using the BFS float in the case of significant corneal astigmatism is an hourglass [6] and in the case of low corneal astigmatism, a central island. Inferior steepening on the sagittal map, localised posterior elevation and displaced thinnest pachymetry would indicate a strong suspicion of keratoconus. Note: posterior bulging often precedes anterior changes.
Elevation maps are the key to diagnosing keratoconus. They are considered normal/abnormal based on comparison to BFS or BTFE. Either reference can be used but the indices for interpretation change according to which reference is used. Note: thresholds can vary by clinical context.
Using the BFS float mode the normal cut off values corresponding to the thinnest location are shown below. Any value which exceeds these cut off values are considered higher risk [7–9].
The highest plus value within the central 5mm zone using the BFTE can also be used: greater than 12 on the anterior elevation or greater than 15 on the posterior elevation is considered to be higher risk [8,9].
Additionally, the Belin–Ambrósio enhanced ectasia display (BAD-D) composite index combines anterior and posterior elevation, pachymetric deviation and corneal thickness progression data into a single summary score. A BAD-D score above 1.6 is considered suspicious for ectasia and above 2.6 is highly abnormal [3,7]. This is one of the most clinically useful single values on the Pentacam report for ectasia screening and should be routinely assessed alongside the individual maps.
5. Assess pachymetry map and thickness pattern
On the pachymetry map, a normal cornea demonstrates a smooth, concentric and progressive thickening from the centre toward the periphery. Deviations from this pattern, such as dome, bell or globus configurations, raises suspicion for ectasia [9].
Central corneal thickness at the apex is typically 500–550µm and the thinnest point should lie close to the apex. A thinnest pachymetry <470µm is suspicious and generally contraindicates corneal refractive surgery.
The x- and y-coordinates indicate horizontal and vertical displacement of the thinnest point. A y-coordinate more negative than -0.50mm (significant inferior displacement) is suspicious [6,9].
At the 4mm zone, the normal central superior inferior thickness difference should be <30µm. The thickness difference between the apex and thinnest point is normally ≤10µm [6,9].
6. Interpret the corneal asphericity (Q value)
The Q value describes corneal asphericity within the 6mm optical zone and reflects the rate of curvature change from centre to periphery [10]. Normal corneas are prolate (Q 0 to -1), meaning a steeper centre and flatter periphery, with typical values between -0.26 and -0.45. A positive Q indicates an oblate profile (flat centre, steep periphery), often post myopic refractive surgery. A Q <-1 (hyperprolate) is abnormal; highly negative values are suspicious for keratoconus [3,6].
Conversely, hyperopic refractive laser correction steepens the central cornea relative to the periphery, inducing a hyperprolate (Q <-1, i.e. more negative) profile [9]; this is an expected post-surgical finding and should not be mistaken for keratoconus in this context.
7. Analyse anterior chamber metrics
Assessment of anterior chamber parameters is essential, particularly when planning phakic IOL implantation. The internal anterior chamber depth (ACD) – measured from the corneal endothelium to the anterior lens surface – is the most clinically relevant value. The adult population mean internal ACD is approximately 2.9–3.5mm; values below 2.8mm are generally considered inadequate for phakic IOL implantation (though specific thresholds vary by implant type and manufacturer guidelines).
8. Evaluate symmetry between eyes
Inter-eye comparison can reveal early pathology, even if symptoms are unilateral. Corneal curvature, thickness and elevation should be broadly symmetrical unless known pathology exists. Young patients are more likely to manifest early ectatic changes. Be mindful of unilateral steepening, thinning, elevation or rapid progression. Concerning inter-eye differences include: mean anterior K >0.30D, mean posterior K >0.10D and thinnest pachymetry >12µm [8].
9. Integrate into a clinical context
Always interpret Pentacam findings with other clinical findings such as patients age, refraction, visual acuity, visual symptoms, family history of eye conditions, such as keratoconus, slit lamp signs and other diagnostic tests such as biometry.
10. Document and monitor changes over time
Save the baseline four map report and compare indices over time such as stability of thinnest point location, elevation or curvature changes and rate of thinning or steepening. The Pentacam allows built-in analysis that allows comparison at different time points which is useful to look for change.
Conclusion
Systematically analysing the Pentacam four maps report allows detailed corneal evaluation. Begin by confirming scan quality, then integrate data from the sagittal curvature, anterior and posterior elevation and pachymetry maps. A structured approach reduces diagnostic error, improves early ectasia detection and strengthens surgical decision-making. It is crucial to recognise patterns and indices suggestive of keratoconus or other ectatic disorders. Always correlate Pentacam findings with clinical examination, refractive stability and patient history.
References
1. Motlagh MN, Moshirfar M, Murri MS, et al. Pentacam® corneal tomography for screening of refractive surgery candidates: a review of the literature, part I. Med Hypothesis Discov Innov Ophthalmol 2019;8(3):177–203.
2. Sridhar U, Tripathy K. Corneal Topography. In: StatPearls [Online]. Treasure Island (FL): StatPearls Publishing; 2025.
3. Chen A, Srikumaran D, Syed Z, Belin MW. Guide to Pentacam interpretation for keratoconus and corneal ectasia. Cornea Open 2025;4(4):e0071.
4. www.pentacam.com/fileadmin/
user_upload/pentacam.de/downloads/
interpretations-leitfaden/Pentacam_Interpretation
_Guide_Ophth_EN_0624.pdf
[Link last accessed March 2026]
5. Matalia H, Swarup R. Imaging modalities in keratoconus. Indian J Ophthalmol 2013;61(8):394–400.
6. Doroodgar F, Mazloomi M, Niazi S, et al. An overview of Pentacam® indices. W J Opthalmol & Vision Res 2025;5(1).
7. Belin MW, Khachikian SS, Ambrosio Jr R. Elevation based corneal tomography, 2nd Edition. NewDelhi, India; Jaypee Brothers Medical Publishers; 2012.
8. Sinjab MM. Corneal tomography in clinical practice (Pentacam system): Basics and clinical interpretation, 4th Edition. New Delhi, India; Jaypee Brothers Medical Publishers; 2021.
9. Sinjab MM. Step by step reading Pentacam Topography: Basics and case study series, 2nd Edition. New Delhi, India; Jaypee Brothers Medical Publishers; 2015.
10. Cavas-Martínez F, De la Cruz Sánchez E, Nieto Martínez J, et al. Corneal topography in keratoconus: state of the art. Eye Vis (Lond) 2016;3:5.
Declaration of competing interests: None declared.