Since its initial use in the eyes fifty years ago, ultrasound has established itself as a common diagnostic technique in ophthalmology. Sonographers, engineers and clinicians from all around the world have contributed to the development of ocular ultrasonography.
As a photographer we rely on using cameras as our workhorse, be it a 35mm handheld, a fundus retinal camera, a fundus wide-field or an OCT camera, all of which use light and / or light waves to capture the image. As wonderful as technology is, there may be times when light is not sufficient, and it is in those situations where we require the use of sound. In this article, I hope to give you an insight in how ultrasound can be used within ophthalmology!
What is ultrasound?
To determine the corrective intraocular lens (IOL) power requirements, ocular ultrasonography is most commonly used to measure globe length. Additional applications include the detection of retinal detachment, visualisation of lens displacement, and measuring of tumours, including choroidal melanomas. Since the eye is known to be a fluid-filled object, it is perfect for visualising the anatomy and observing ocular pathology [1]. Ocular ultrasonography operates on the same principles as other uses of this technology. At frequencies higher than 20kHz, sound waves are produced, and any tissue in their path reflects them back to the transducer [2]. A piezo-electric crystal in the transducer vibrates in response to the sound wave's return, producing electrical impulses that are converted into a picture or other data.
Higher frequency waves provide better resolution but less tissue penetration. Lower frequency waves, on the other hand, have worse resolution but penetrate deeper. Similar to other waves, ultrasound waves exhibit predictable behaviours depending on the characteristics of the medium they pass through [3]. For example (remembering back to your physics days at school), sound waves move more quickly through solids than through liquids. Sound waves can scatter, reflect, or refract when they move between tissue interfaces with varying acoustic impedances or densities. Additionally, tissue absorbs some sound. Echoes are sound waves that bounce back to the transducer, and there are three types of ultrasound imaging zones: hyperechoic, hypoechoic, and anechoic. An anechoic area may emerge from shadowing that happens distal to a particularly thick lesion [4].
- Hyperechoic – a tissue that reflects a lot of sound waves and can appear lighter than its surroundings on ultrasound.
- Hypoechoic – a tissue that absorbs a lot of sound waves and can appear darker than its surroundings on ultrasound.
- Anechoic – free from echo or tends to deaden sound returns.
Ultrasound types
There are two main types of ultrasounds used in ophthalmologic practice currently: A-Scan and B-scan.
In A-scan, or ‘time-amplitude scan’, sound waves are generated at 8MHz and converted into spikes that correspond with tissue interface zones to determine the separation between various structures inside the eye – a single, one-dimensional sound beam is utilised. It’s mostly used to measure the eye's axial length, which is essential for figuring out how much power an IOL has to have after cataract surgery. After applying drops to numb the eye, the A-scan probe is positioned directly on the cornea [4].
 Advantage and disadvantages between A and B scans.
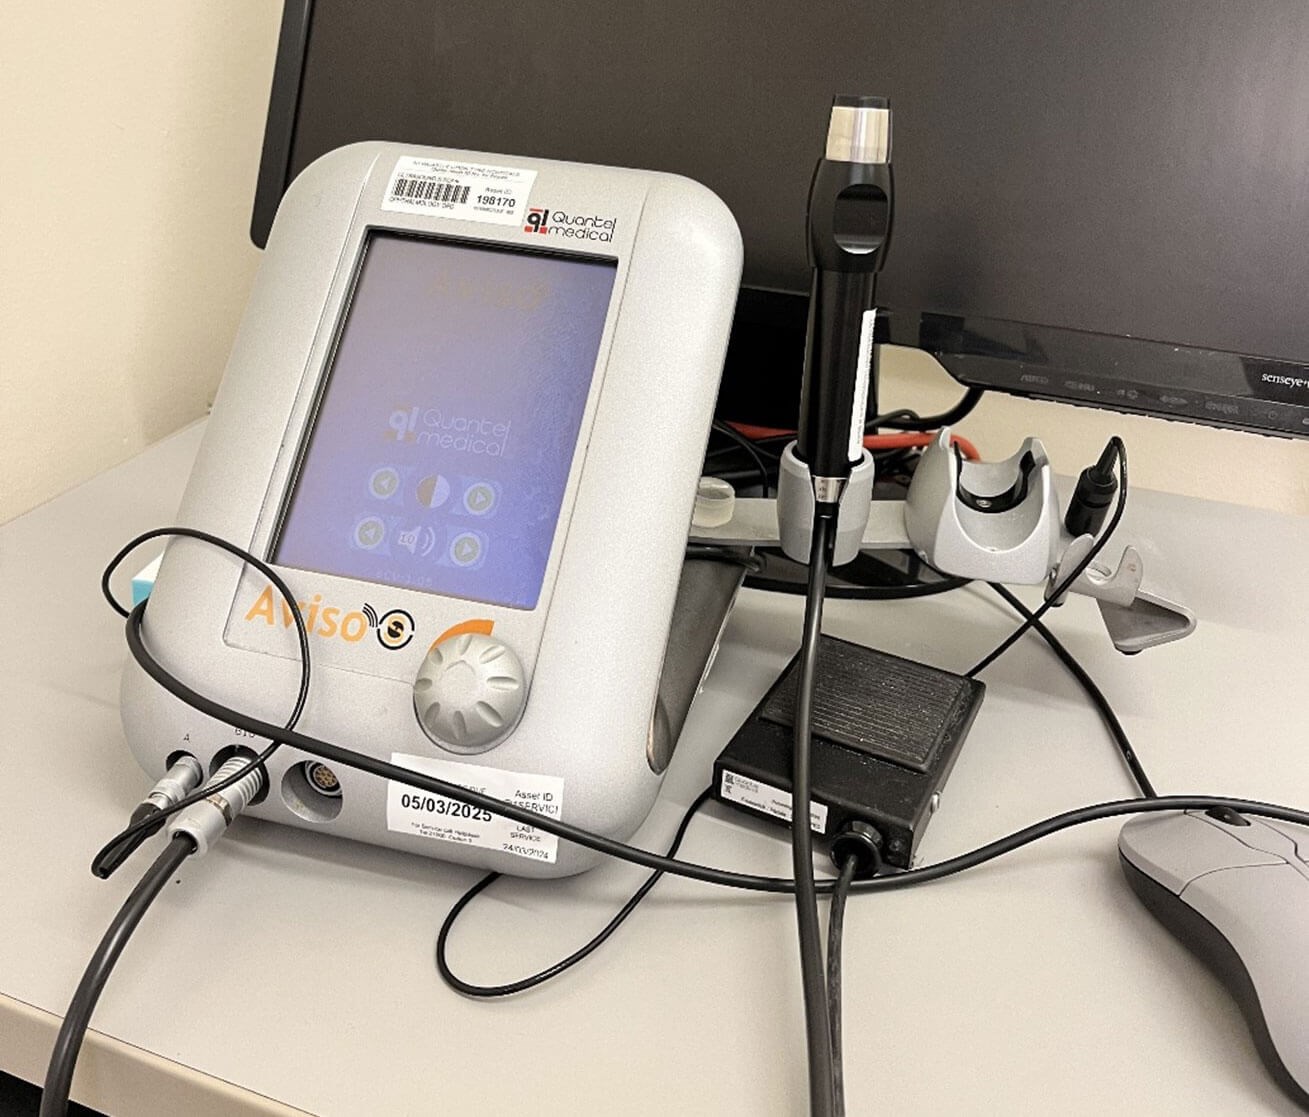
Figure 1: Example of an ultrasound scanner.

Figure 2: Example of a probe.
In B-scan, or ‘brightness amplitude scan’, sound waves are generated at 10MHz. The data collected by the transducer produces a corresponding image that gives a cross-sectional, two-dimensional picture of the orbit around the eye and its interior features. To produce an image, a B-scan employs a two-dimensional array of one-dimensional A-scan beams, the patient is requested to look in various directions while the B-scan probe is applied to the closed eyelid [4].
What is gain control?
One of the main components of B-scan acquisition is gain control, coupled with scan orientation. Gain control modifies the scan's sensitivity and signal strength. More subtle structures like the posterior hyaloid, vitreous opacities, or tiny foreign bodies can be detected at higher gain levels (80–90dB). But doing so comes with more noise, which could make interpretation more difficult. Stronger signals (from more highly reflecting structures like disc drusen) may be emphasised by lower gain levels (60–70dB), at the expense of weaker signals and a reduction in penetration depth [5].
Scan orientation
B-scan probes contain a marking close to the probe tip that matches the top of the scanned plane to aid in examiner orientation. Whether the scan is axial, longitudinal or transverse in orientation depends on where the marker is in reference to the eye (Figure 2) [5].
Transverse scans
Transverse scans allow the examiner to assess a wide region of the posterior segment by imaging each quadrant of the eye. They are also employed to ascertain a lesion's lateral extent. Depending on which eye is being scanned, nasal and temporal scans are labelled as T3 or T9, while superior and inferior scans are defined as T6 and T12, respectively. Transverse scans are also distinguished by clock hours [5].
The probe axis is positioned parallel to the limbus opposite the quadrant of interest, and the patient faces in the direction of the quadrant being imaged during each scan. According to tradition, the probe marker should always be positioned superiorly or nasally: superiorly for T3 and T9, and nasally for T6 and T12 [5].

For instance, the patient looks superiorly, and the probe is positioned at the inferior limbus, with the marker orientated nasally, if the superior quadrant (T12) is to be investigated. The optic nerve is usually located in the middle of the fundus on transverse scans.
The examiner should first locate the optic nerve before doing a transverse scan. To photograph the entire quadrant from posterior to anterior, the examiner then moves the probe posteriorly along the globe's outline, from the limbus to the fornix.
A probe positioned closer to the limbus will photograph the areas posterior to the equator once per clock hour. On the other hand, if the probe is positioned near the fornix, it can photograph the more anterior retina and ora serrata, which is a helpful orientation to help detect retinal tears [6]. Equator posterior, equator, equator anterior, ora serrata, ciliary body, posterior pole, and posterior to the equator are the usual labels for the estimated location photographed.
Longitudinal scans
When determining the anterior-posterior extent of a lesion, longitudinal scans are helpful. The clock hour being photographed (e.g. L3, L6, L9, L12) designates this scan orientation. The probe is positioned next to the opposing limbus while the patient stares in the direction of the meridian being scanned. The marker on the probe points to the centre of the cornea, and the probe axis is positioned perpendicular to the limbus. For instance, the patient's gaze should be aimed superiorly to image L12. The probe marker should be pointing superiorly when the probe is positioned at the inferior limbus. The anterior periphery should be visible at the top and the optic nerve at the bottom of the comparable picture. Depending on where the lesion of interest is located, oblique longitudinal orientations may also be utilised [5].
Axial scans
Axial scans make it simple to evaluate the eye's posterior pole. The patient is in primary gaze while the probe is centred on the cornea for these scans. This scan offers a good picture of the macula and optic nerve when the probe axis is horizontal. However, because axial scans pass the signal straight through the cornea and lens, resulting in reduced resolution or even artefact in individuals with pseudophakia, the diagnostic value of this orientation is restricted [5].
Macular scans
HMAC (horizontal), VMAC (vertical), TMAC (transverse) and LMAC (longitudinal) are the four standard macular scans. When evaluating the condition of the macula in a retinal detachment, macular scans are especially helpful [5].
HMAC is an axial scan in which the probe marker is positioned nasally at 3 or 9 o'clock, and the probe is positioned on the cornea's apex. The optic nerve will be directly above the macula, which will be in the middle of the scan [5]. A similar procedure is used to obtain VMAC, except the probe marker is positioned at the 12 o'clock meridian. This scan will not reveal the nerve.
The patient must fixate slightly temporally in order to get TMAC. With the marker pointed to 12 o'clock, the probe is positioned on the nasal sclera. Furthermore, this scan will not show the nerve. To prevent reverberation artefact, TMAC enables a vertical scan through the macula without going through the lens [5].
Lastly, the subject is made to fixate slightly over time to achieve LMAC. With the marker pointing temporally (3 or 9 o'clock), the probe is positioned immediately posterior to the nasal limbus. The lateral rectus muscle can be seen penetrating into the globe at the top of the scan, while the optic nerve will be seen at the bottom, followed by the macula in the middle. Bypassing the lens, LMAC offers a horizontal scan through the macula [5].
Basic steps in performing scans
Even though different examiners may use different picture acquisition sequences, it's crucial to have a uniform method for every patient. Gain should be set high (80–90dB) during the first examination, however it can be adjusted based on the clinical situation. Turning on the A-scan overlay is also helpful because it can help with interpretation.
A coupling agent must be applied to the probe before a scan can be taken since air is very reflecting on ultrasonography. Standard general-purpose ultrasonic gels may contain compounds that could be dangerous when directly applied to the eye; therefore, only hydroxypropyl methylcellulose ophthalmic gels should be utilised as coupling agents [7]. B-scans should typically be taken directly on the eye (after topical anaesthetic treatment). If not, it may be challenging for both the patient and the examiner to verify the precise gaze position when the eyes are closed. Additionally, as the ultrasonic signal travels through the tissue of the eyelids, it is weakened [5].
This is not always the case, though, as it is preferable to insert the probe above the closed eyelid in juvenile patients or in cases of trauma. Even mild ultrasound should be used carefully in cases of possible globe perforation, and further imaging techniques like CT scans should be taken into consideration to assess the globe further [5].
To get a first impression of the posterior segment, begin with a horizontal axial view, which means the patient is in primary gaze. Next, do the superior, inferior, nasal and temporal transverse scans (as previously mentioned). Lastly, acquire an LMAC scan [5].
Dynamic scans can also be helpful for evaluating tissue mobility in some diseases. The examiner visualises the tissue of interest while the patient moves their eye back and forth. This method is very helpful for distinguishing between choroidal, retinal, and posterior vitreous detachments [5].
A case study
To illustrate how ultrasound has proven use within a clinical situation, I am going to demonstrate a case from a patient within our trust.
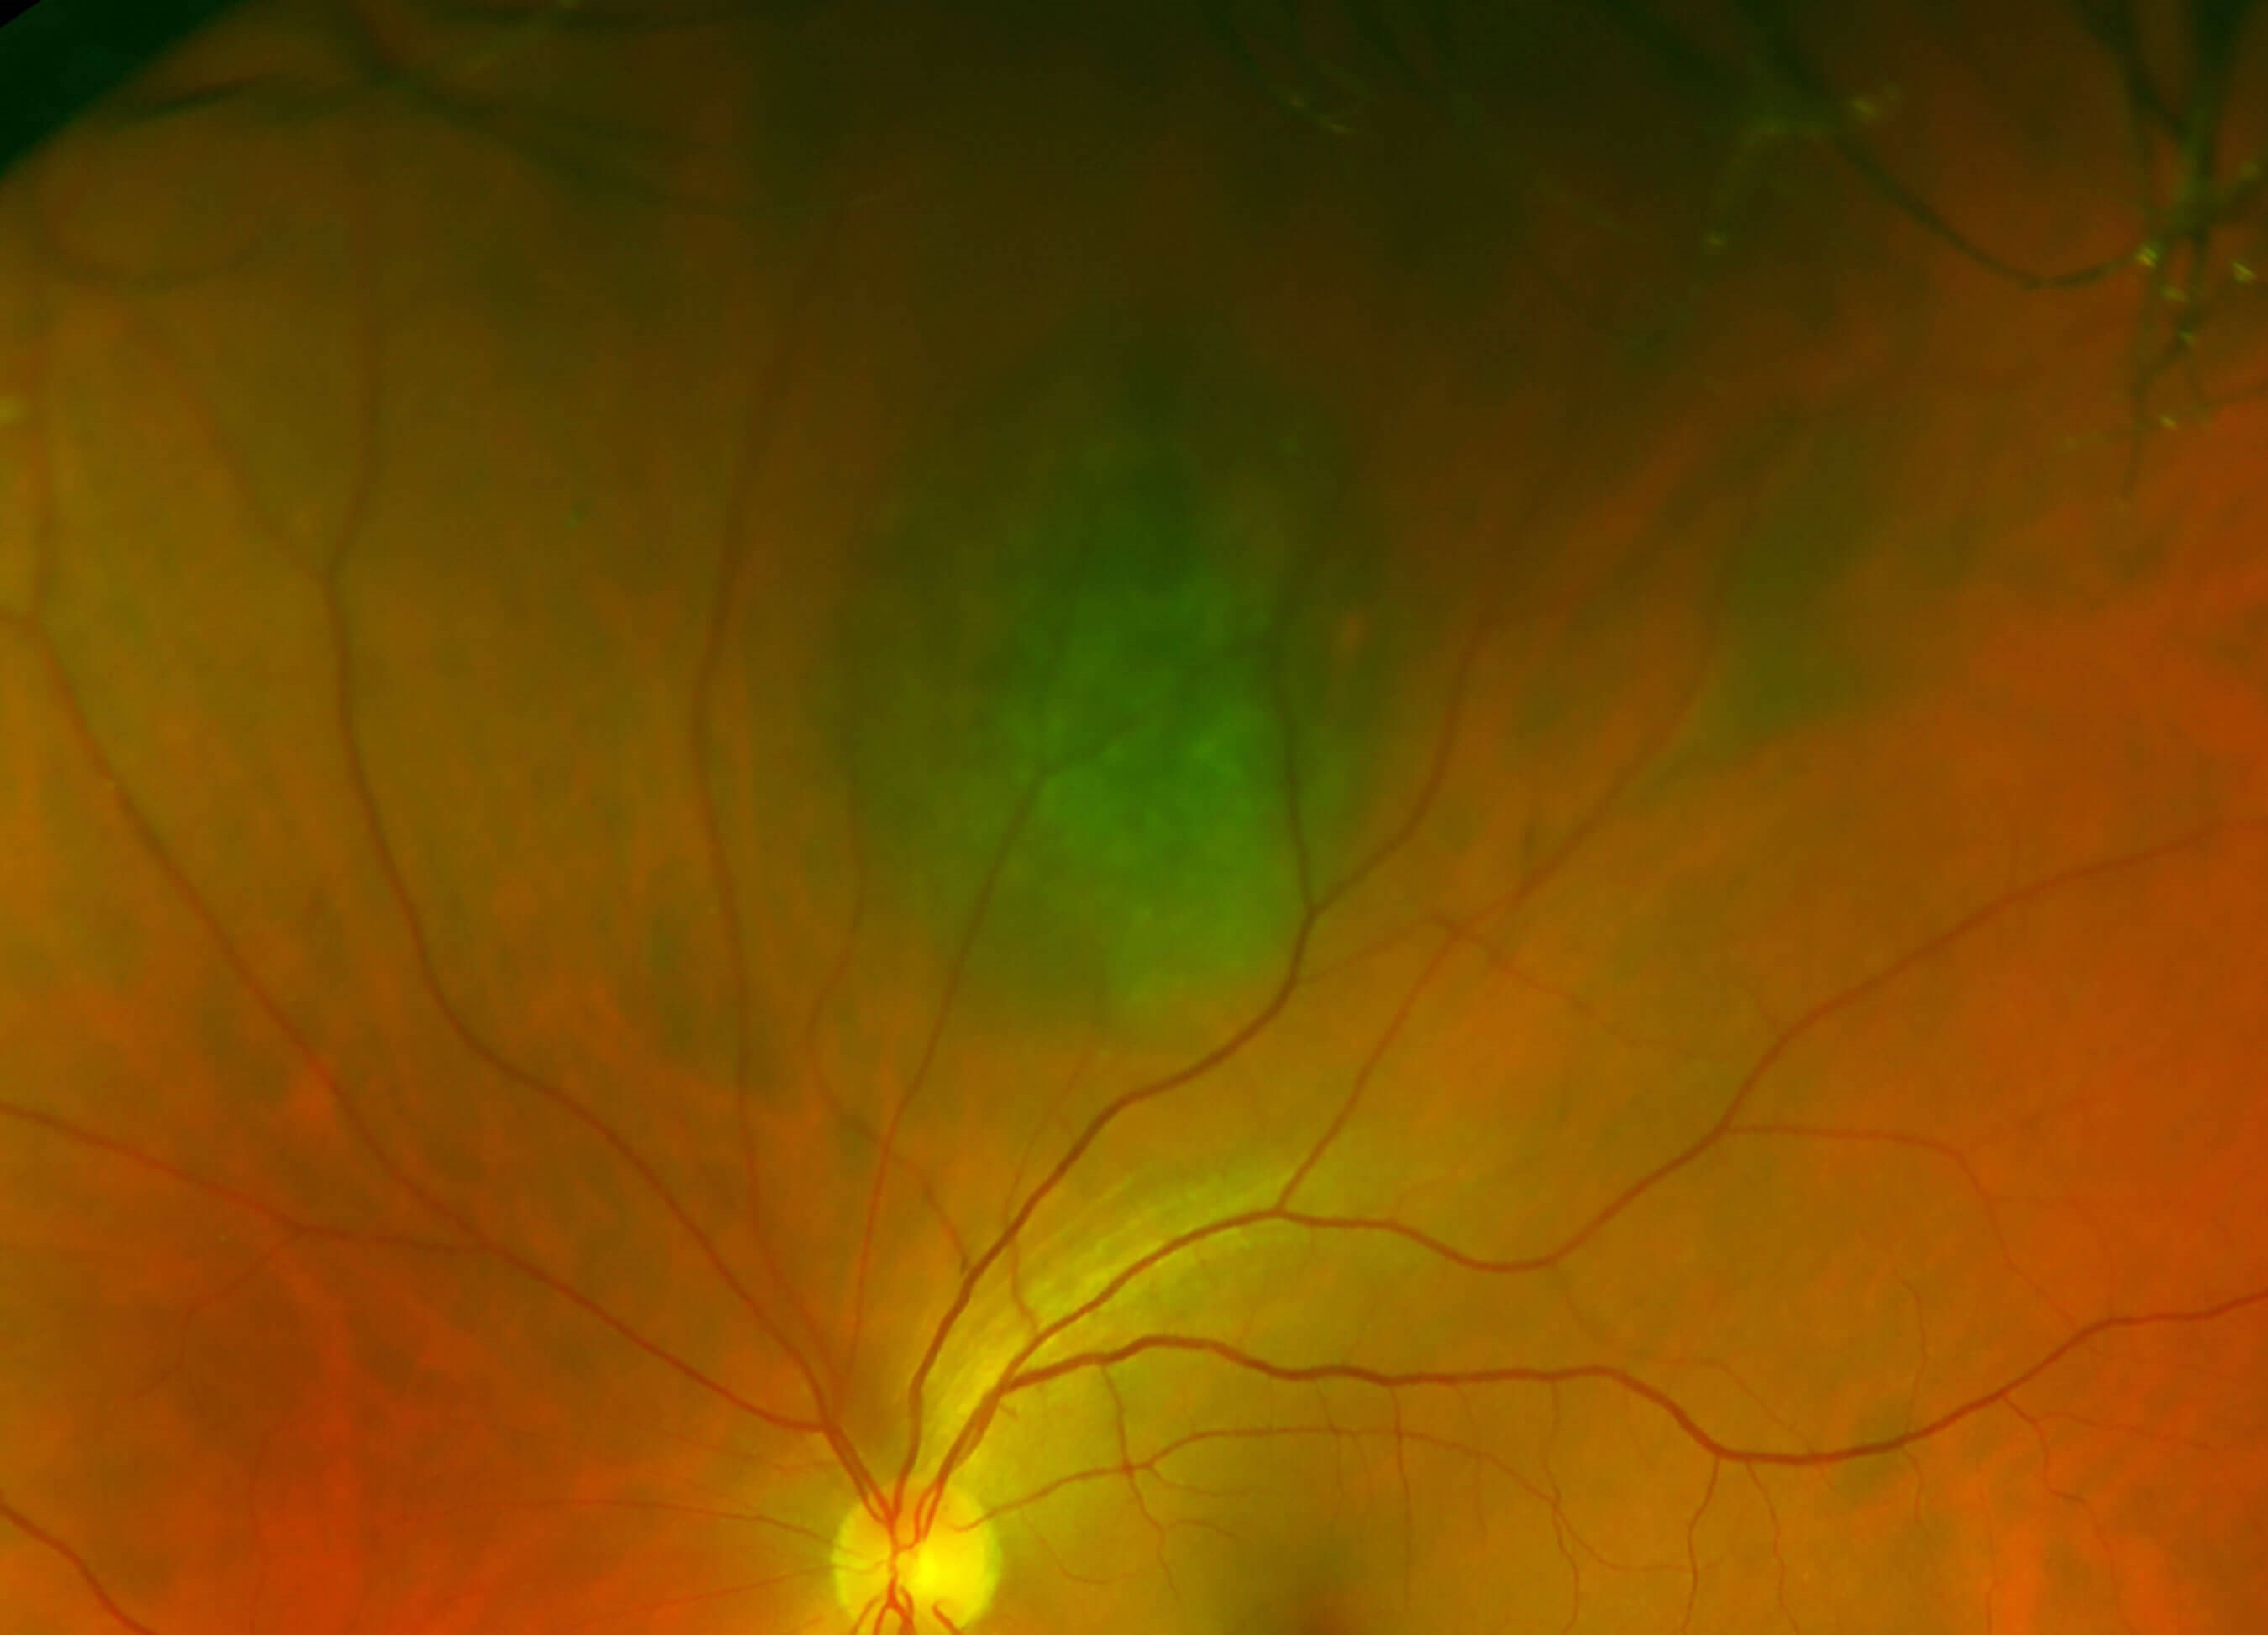
Figure 3.
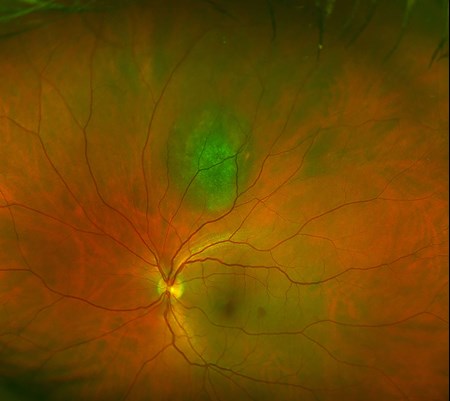
Figure 4.
The patient was a 70-year-old female who first attended in 2016 after a routine optician visit who noticed a choroidal naevus. She was referred to our choroidal naevus clinic. Images were taken on the Optos ultra-wide field camera (Figure 3). The naevus caused no concern and returned in 2017 (Figure 4). Again, no concern and returned in 2019.
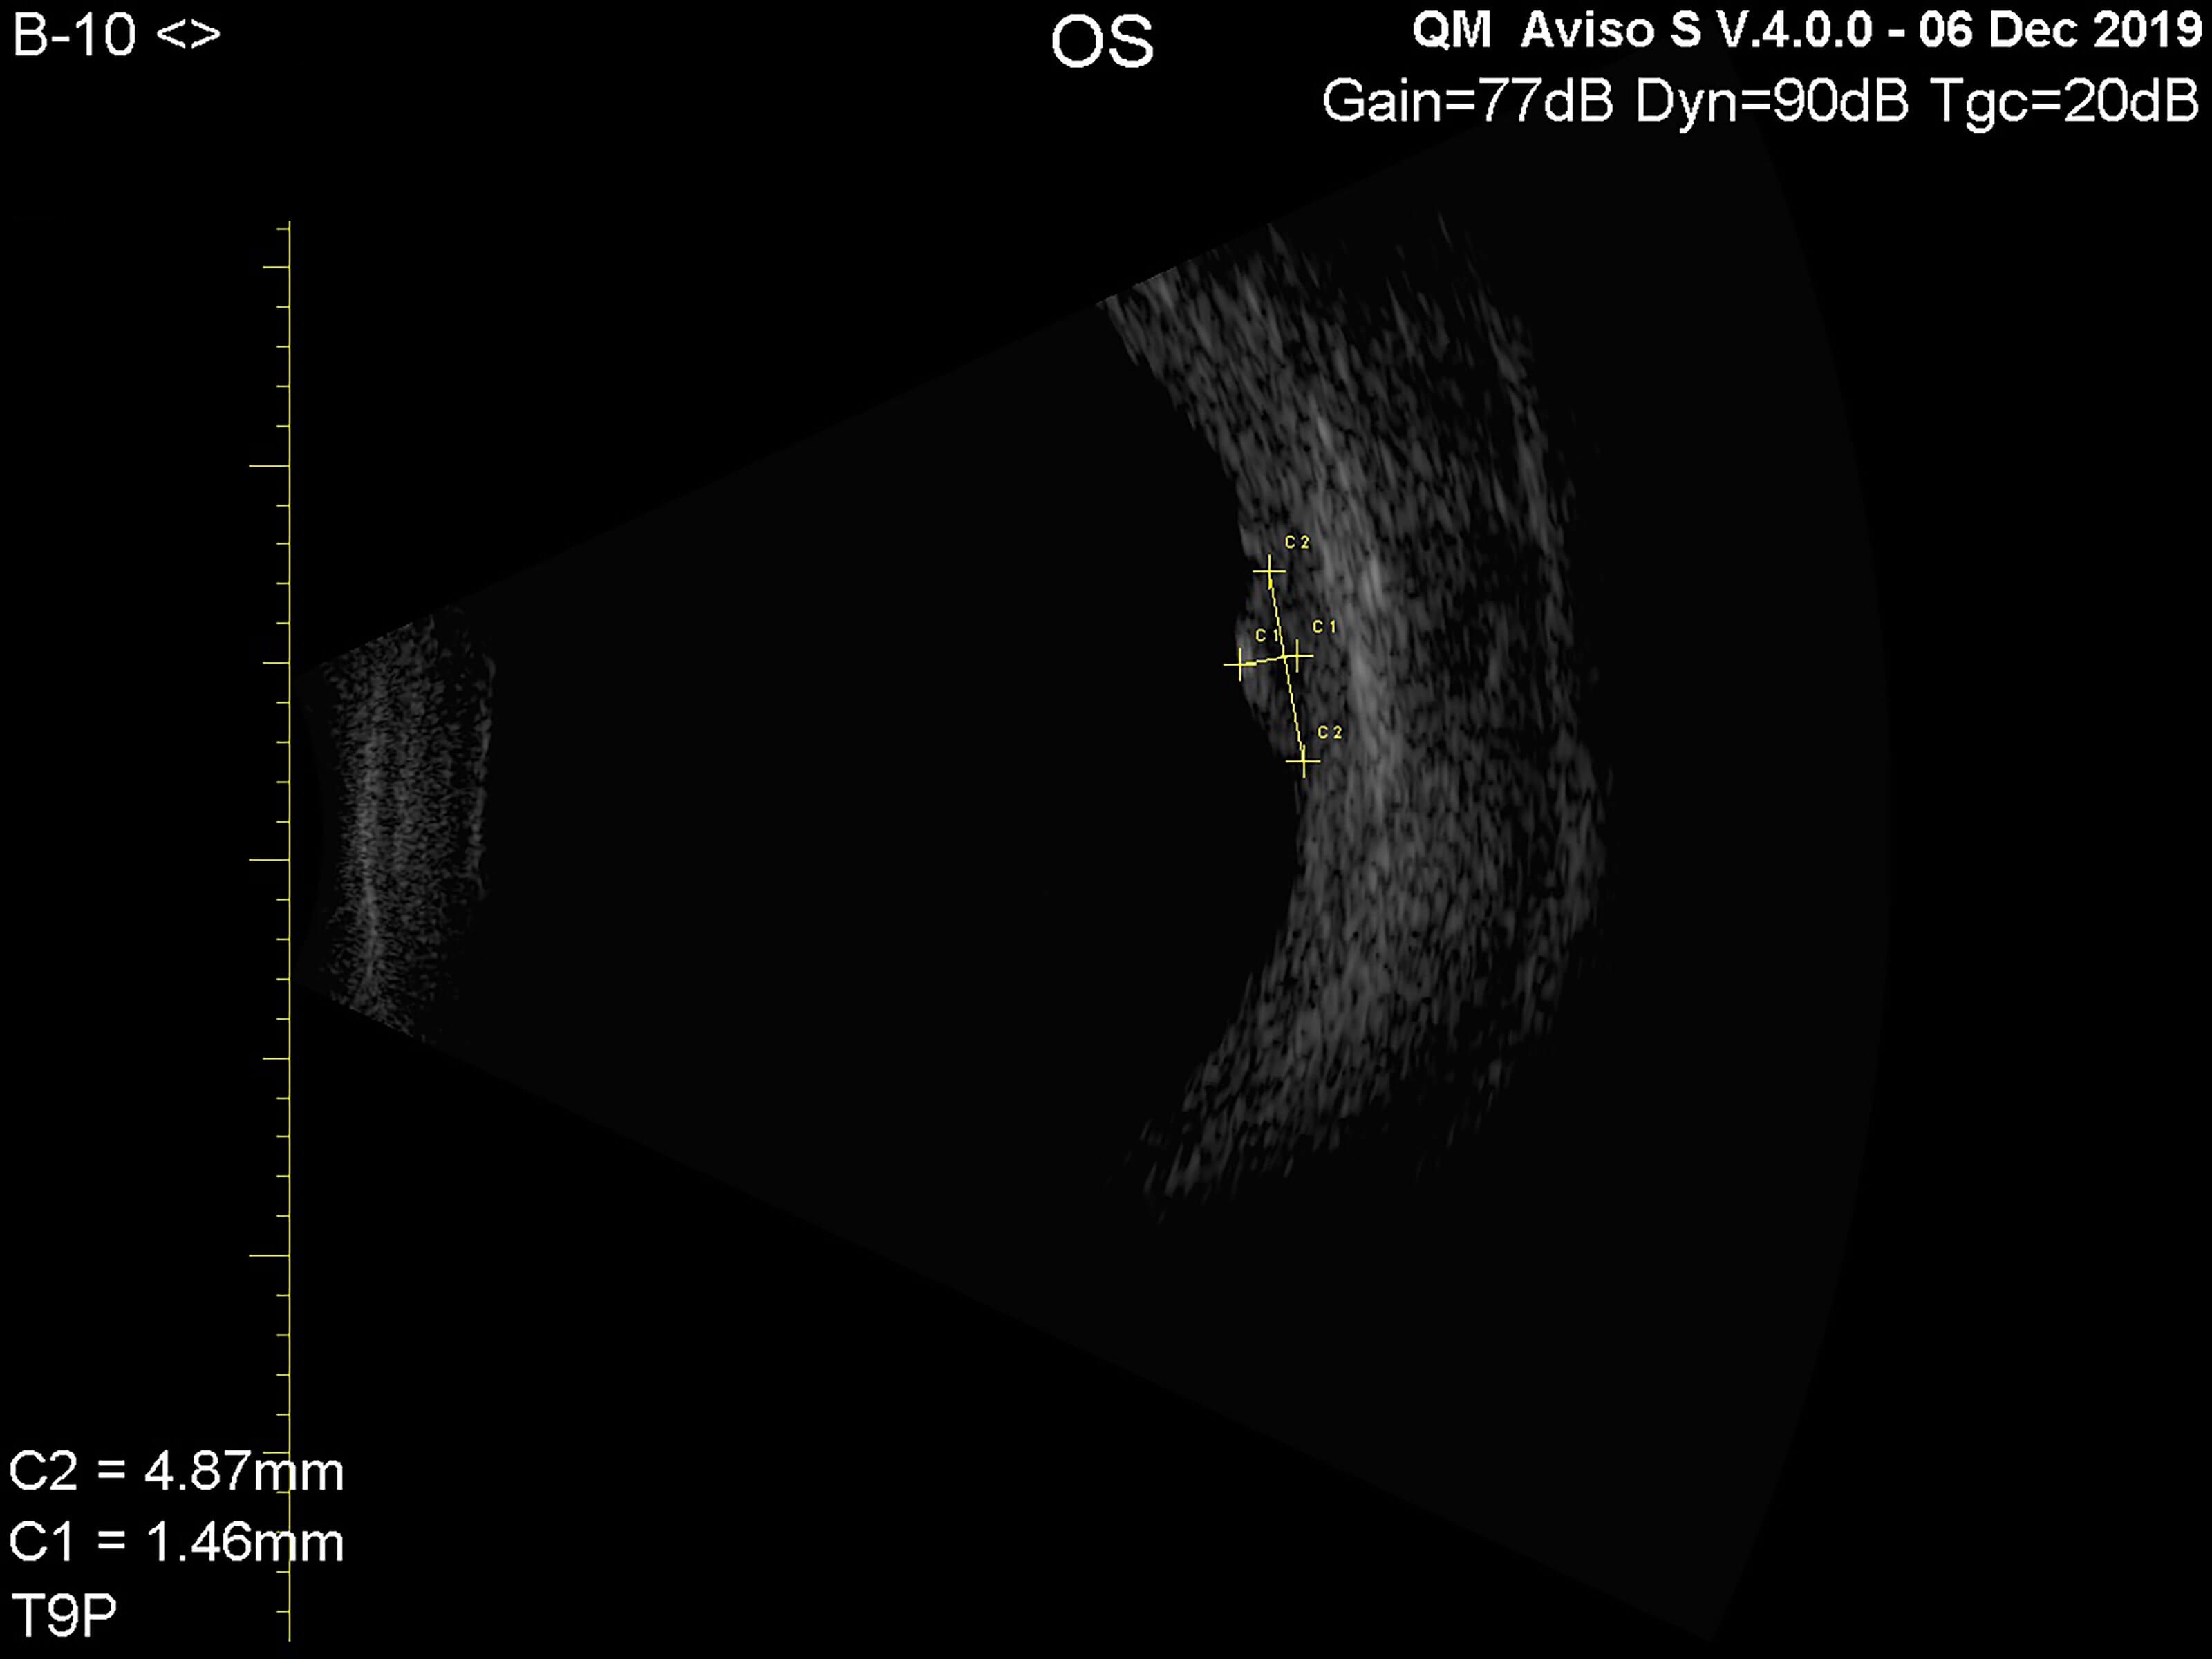
Figure 5.
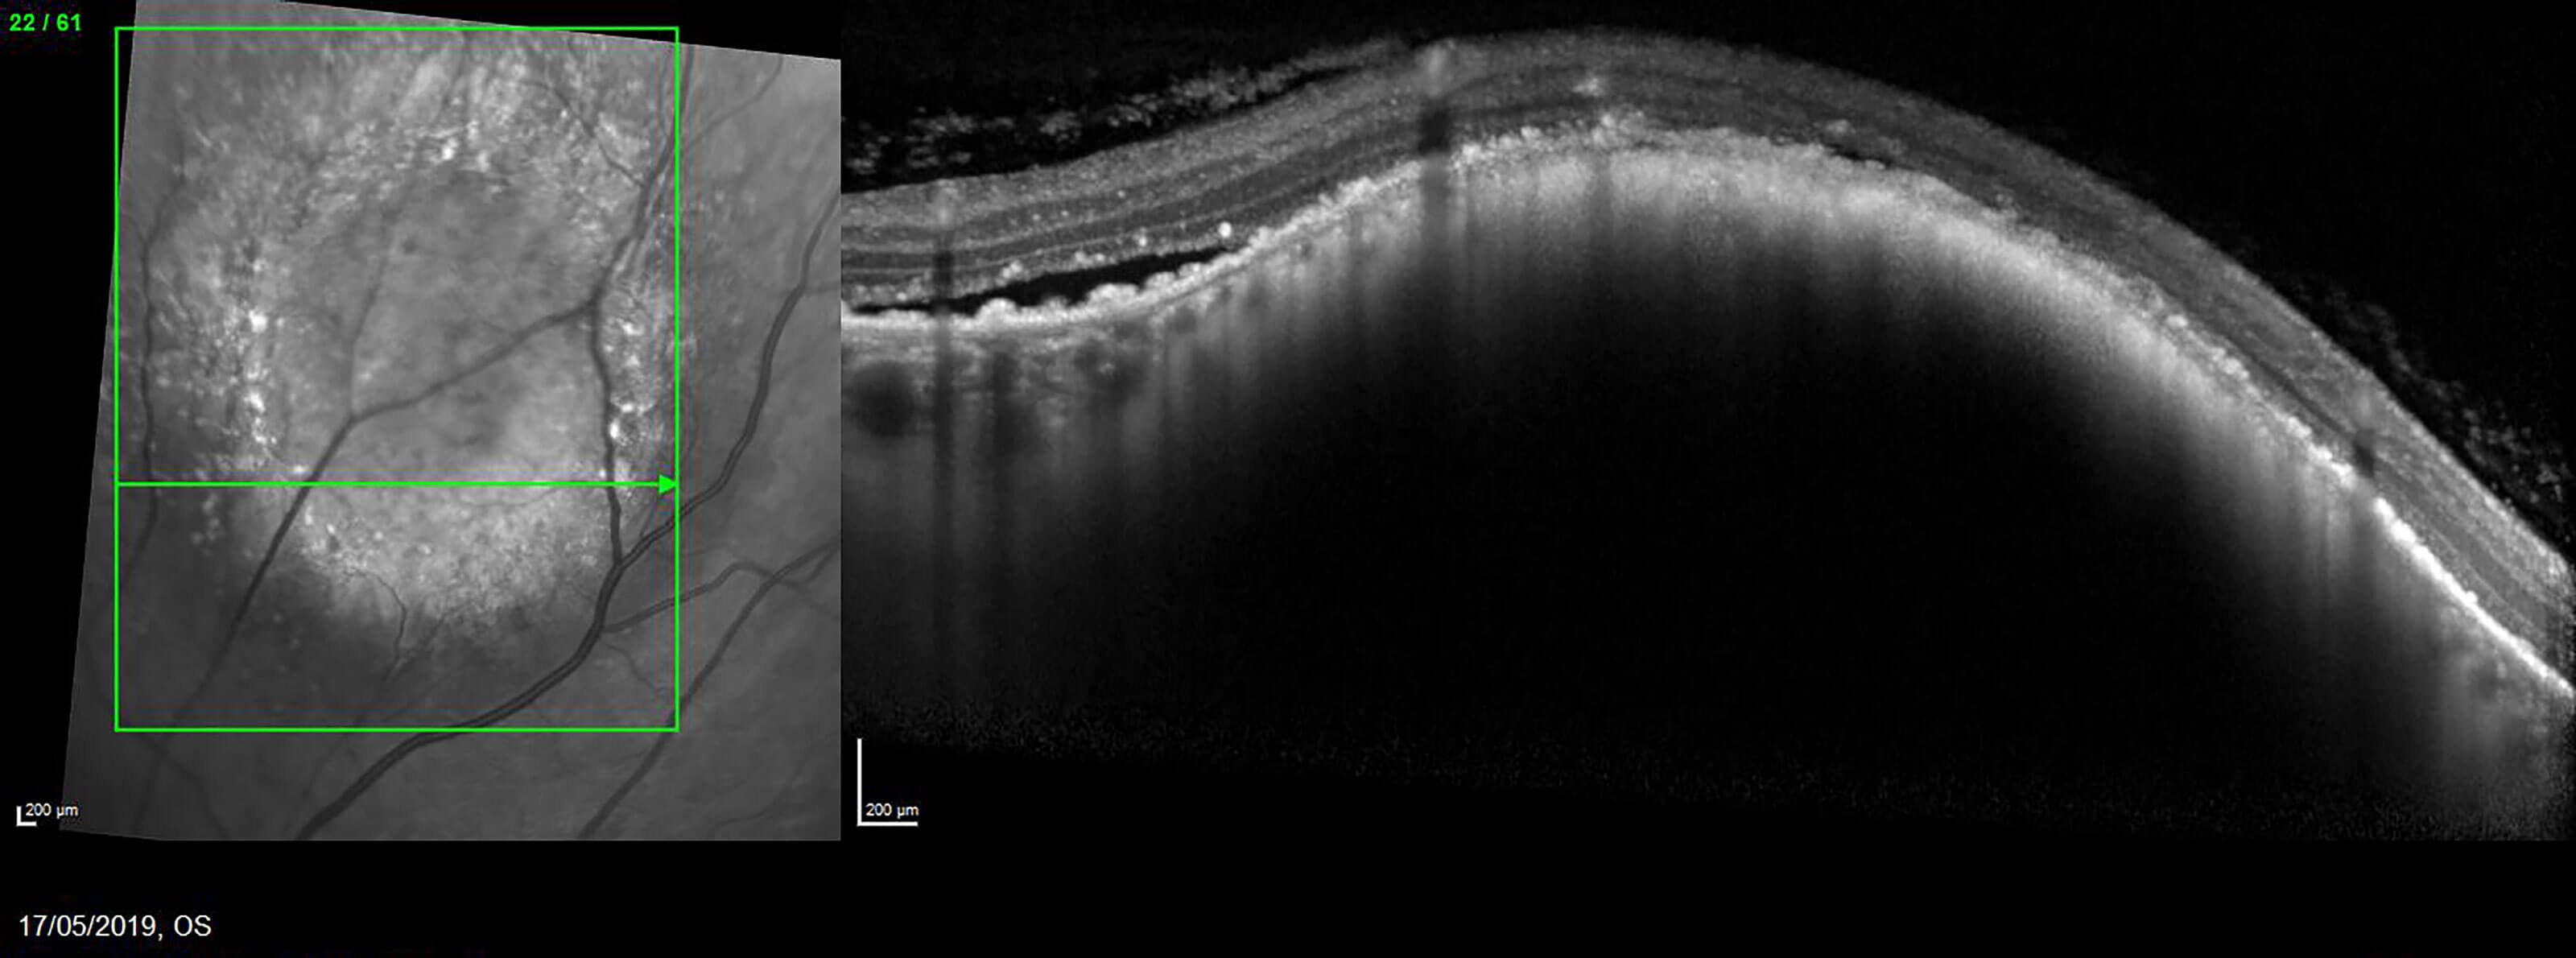
Figure 6.
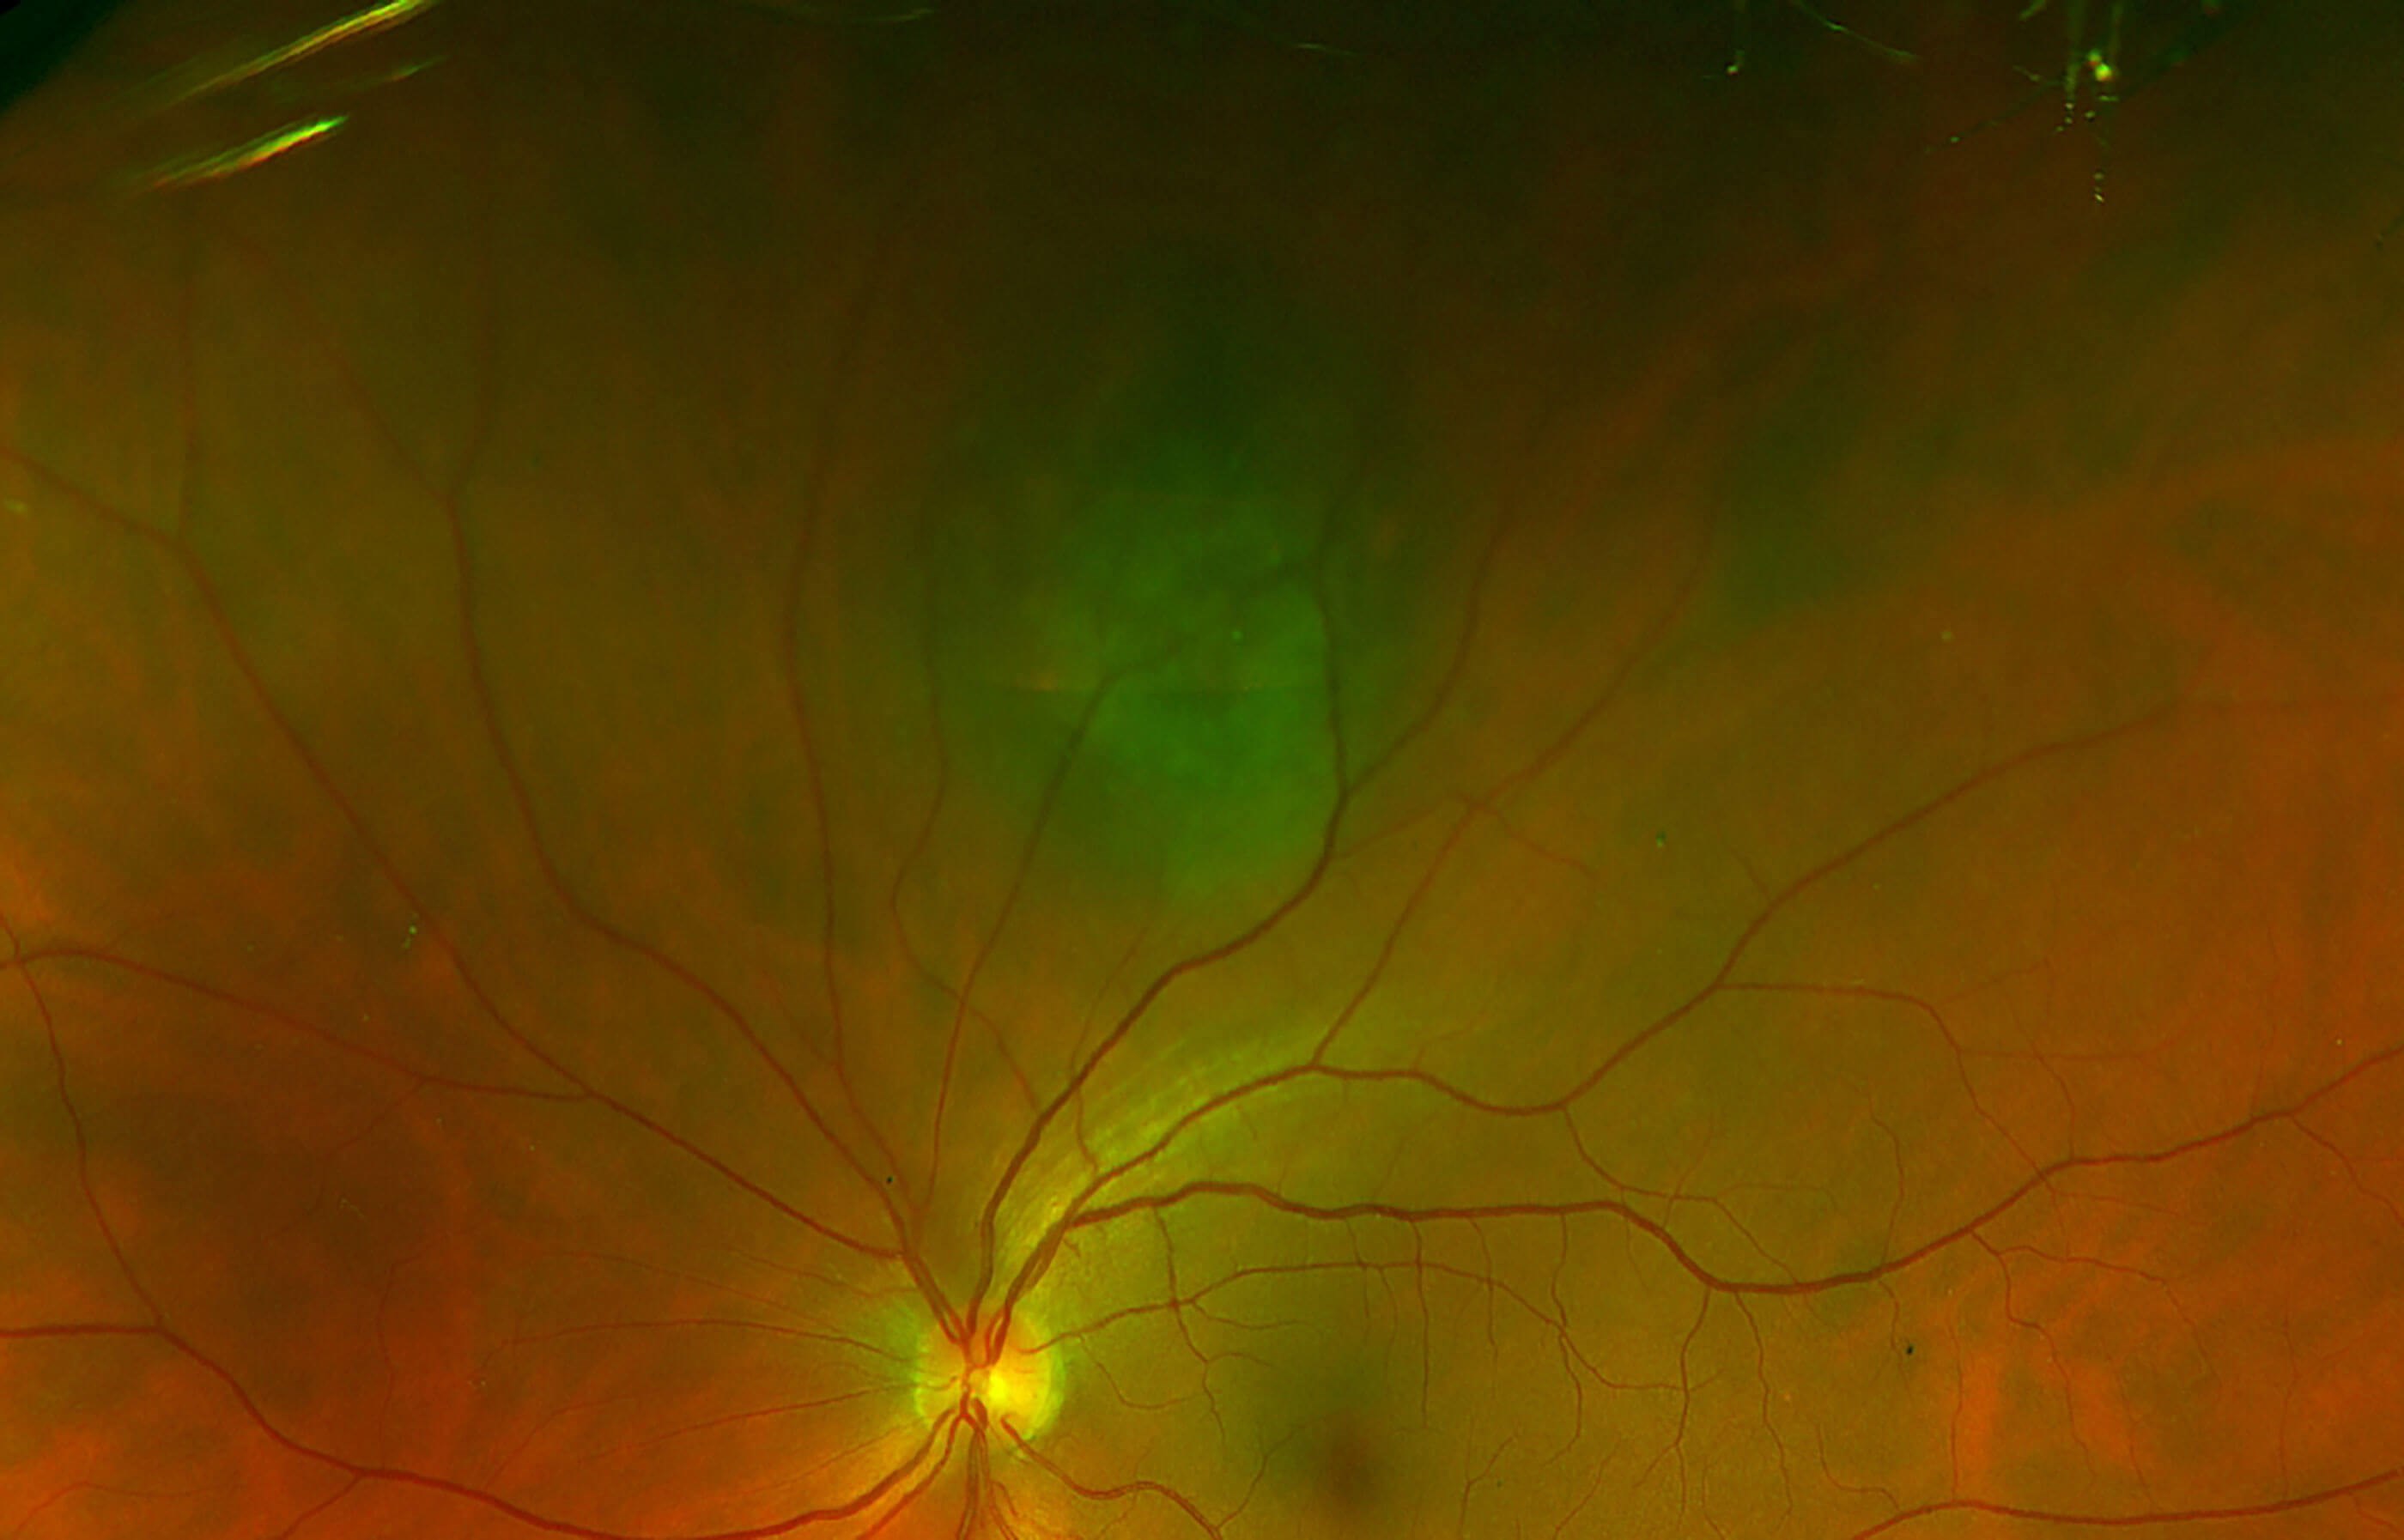
Figure 6a.
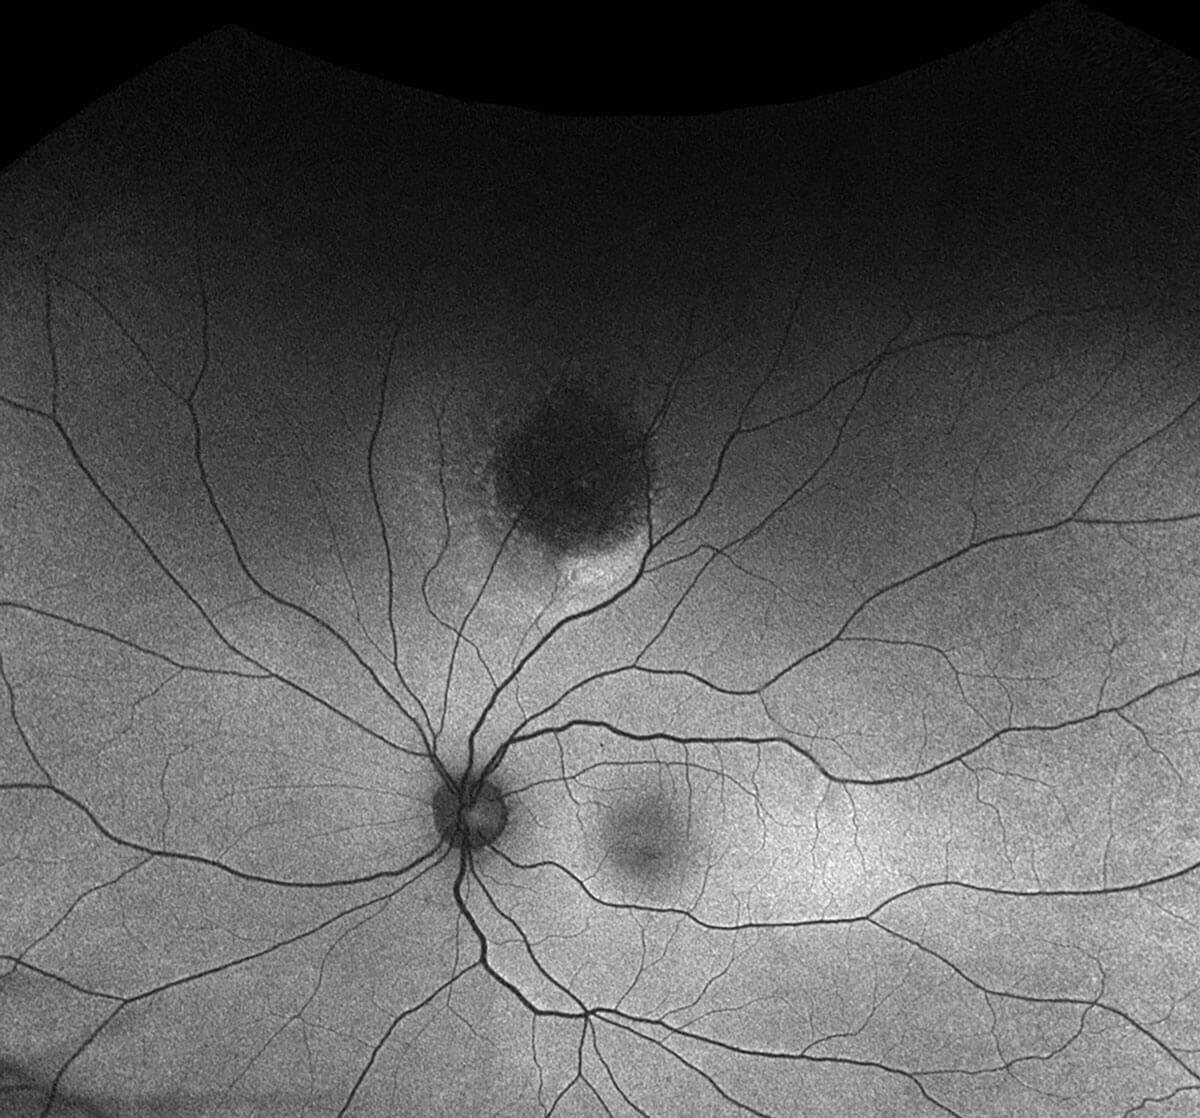
Figure 6b.
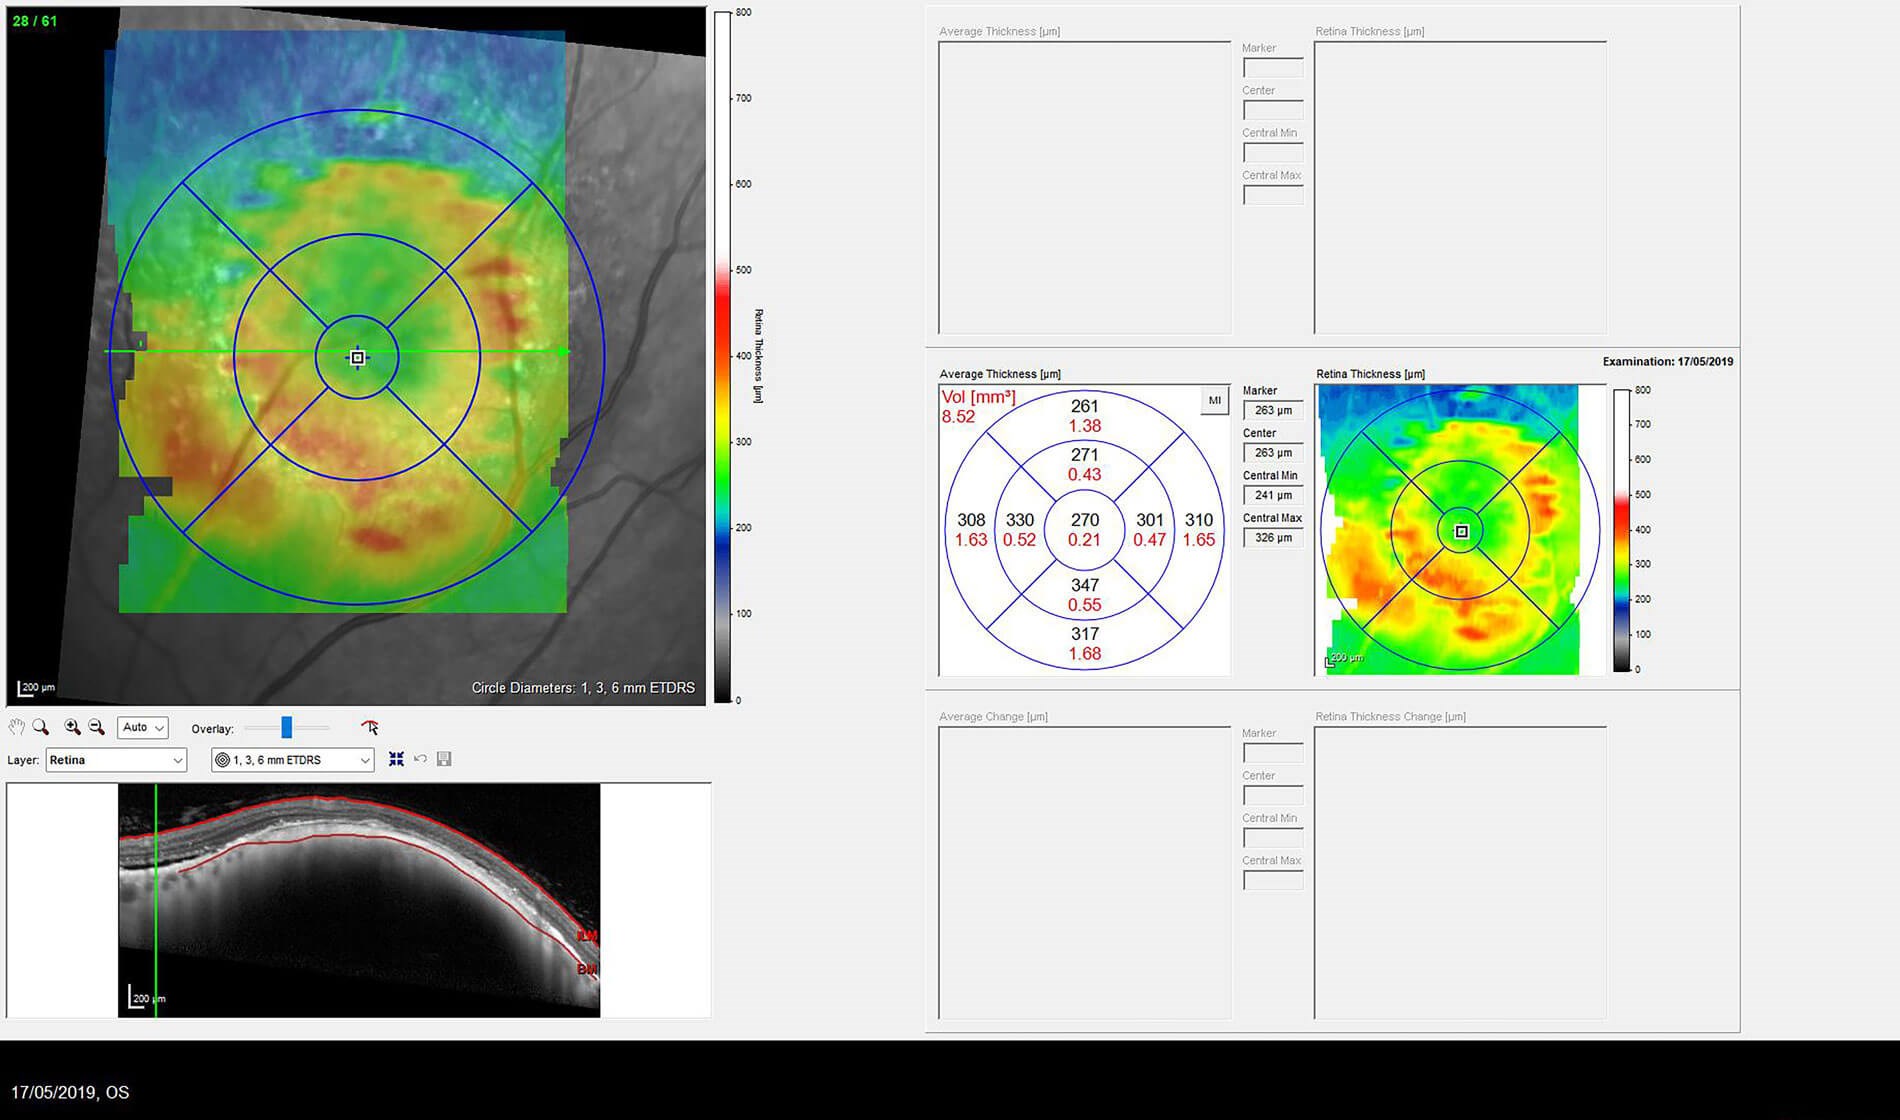
Figure 7.
The choroidal naevus and appearance remain unchanged compared to serial images from 2016. The lesion has a maximum elevation of 1.46mm and the margins show internal reflectivity (Figure 5). The apparent high reflectivity on the surface is due to retinal pigment epithelial hyperplasia. The following images show the OCT with retinal fluid (Figure 6), the OCT thickness map indicating fluid thickness (Figure 7), the colour image (Figure 6a) and the fundus auto fluorescence (Figure 6b).
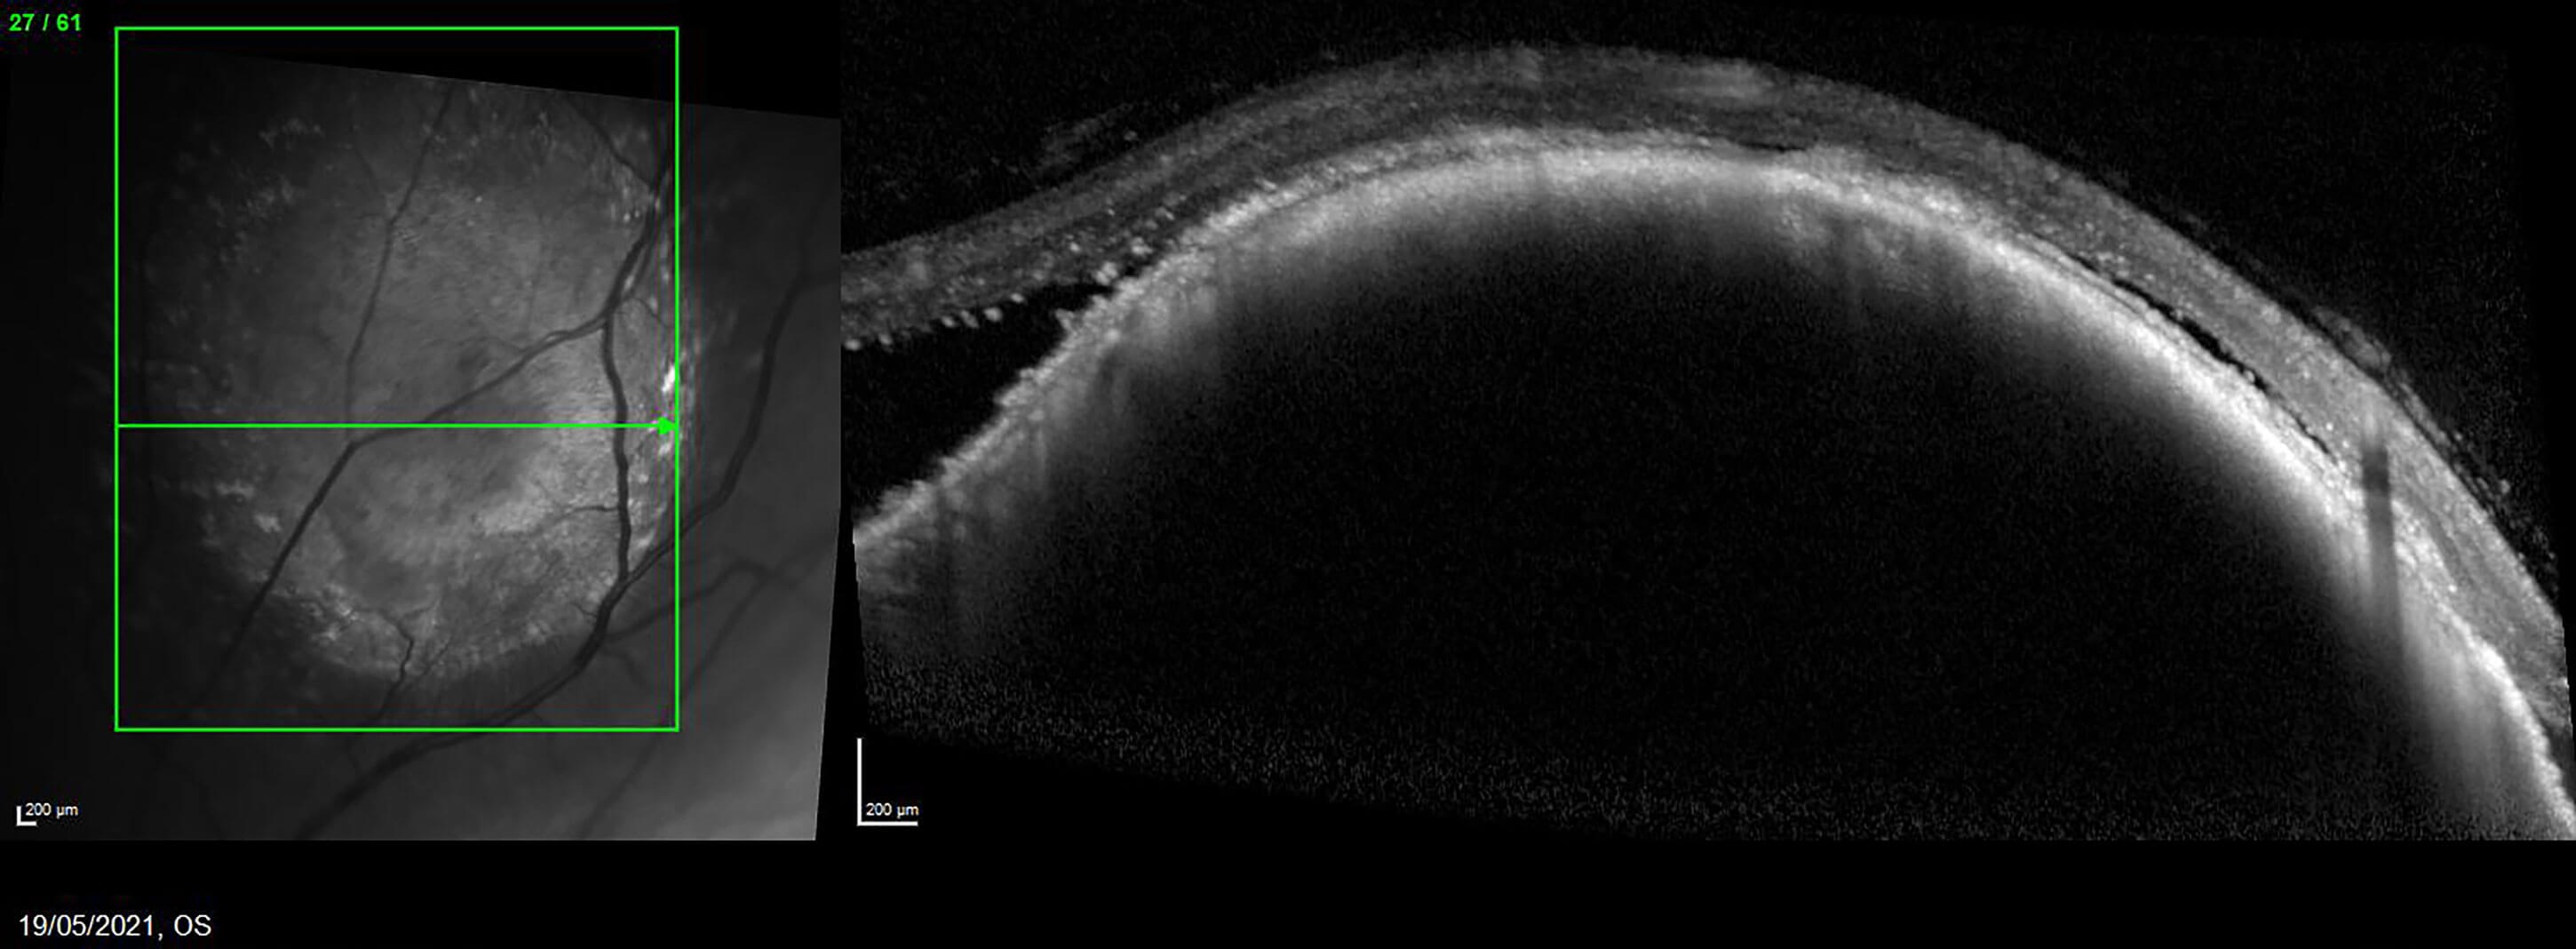
Figure 8.
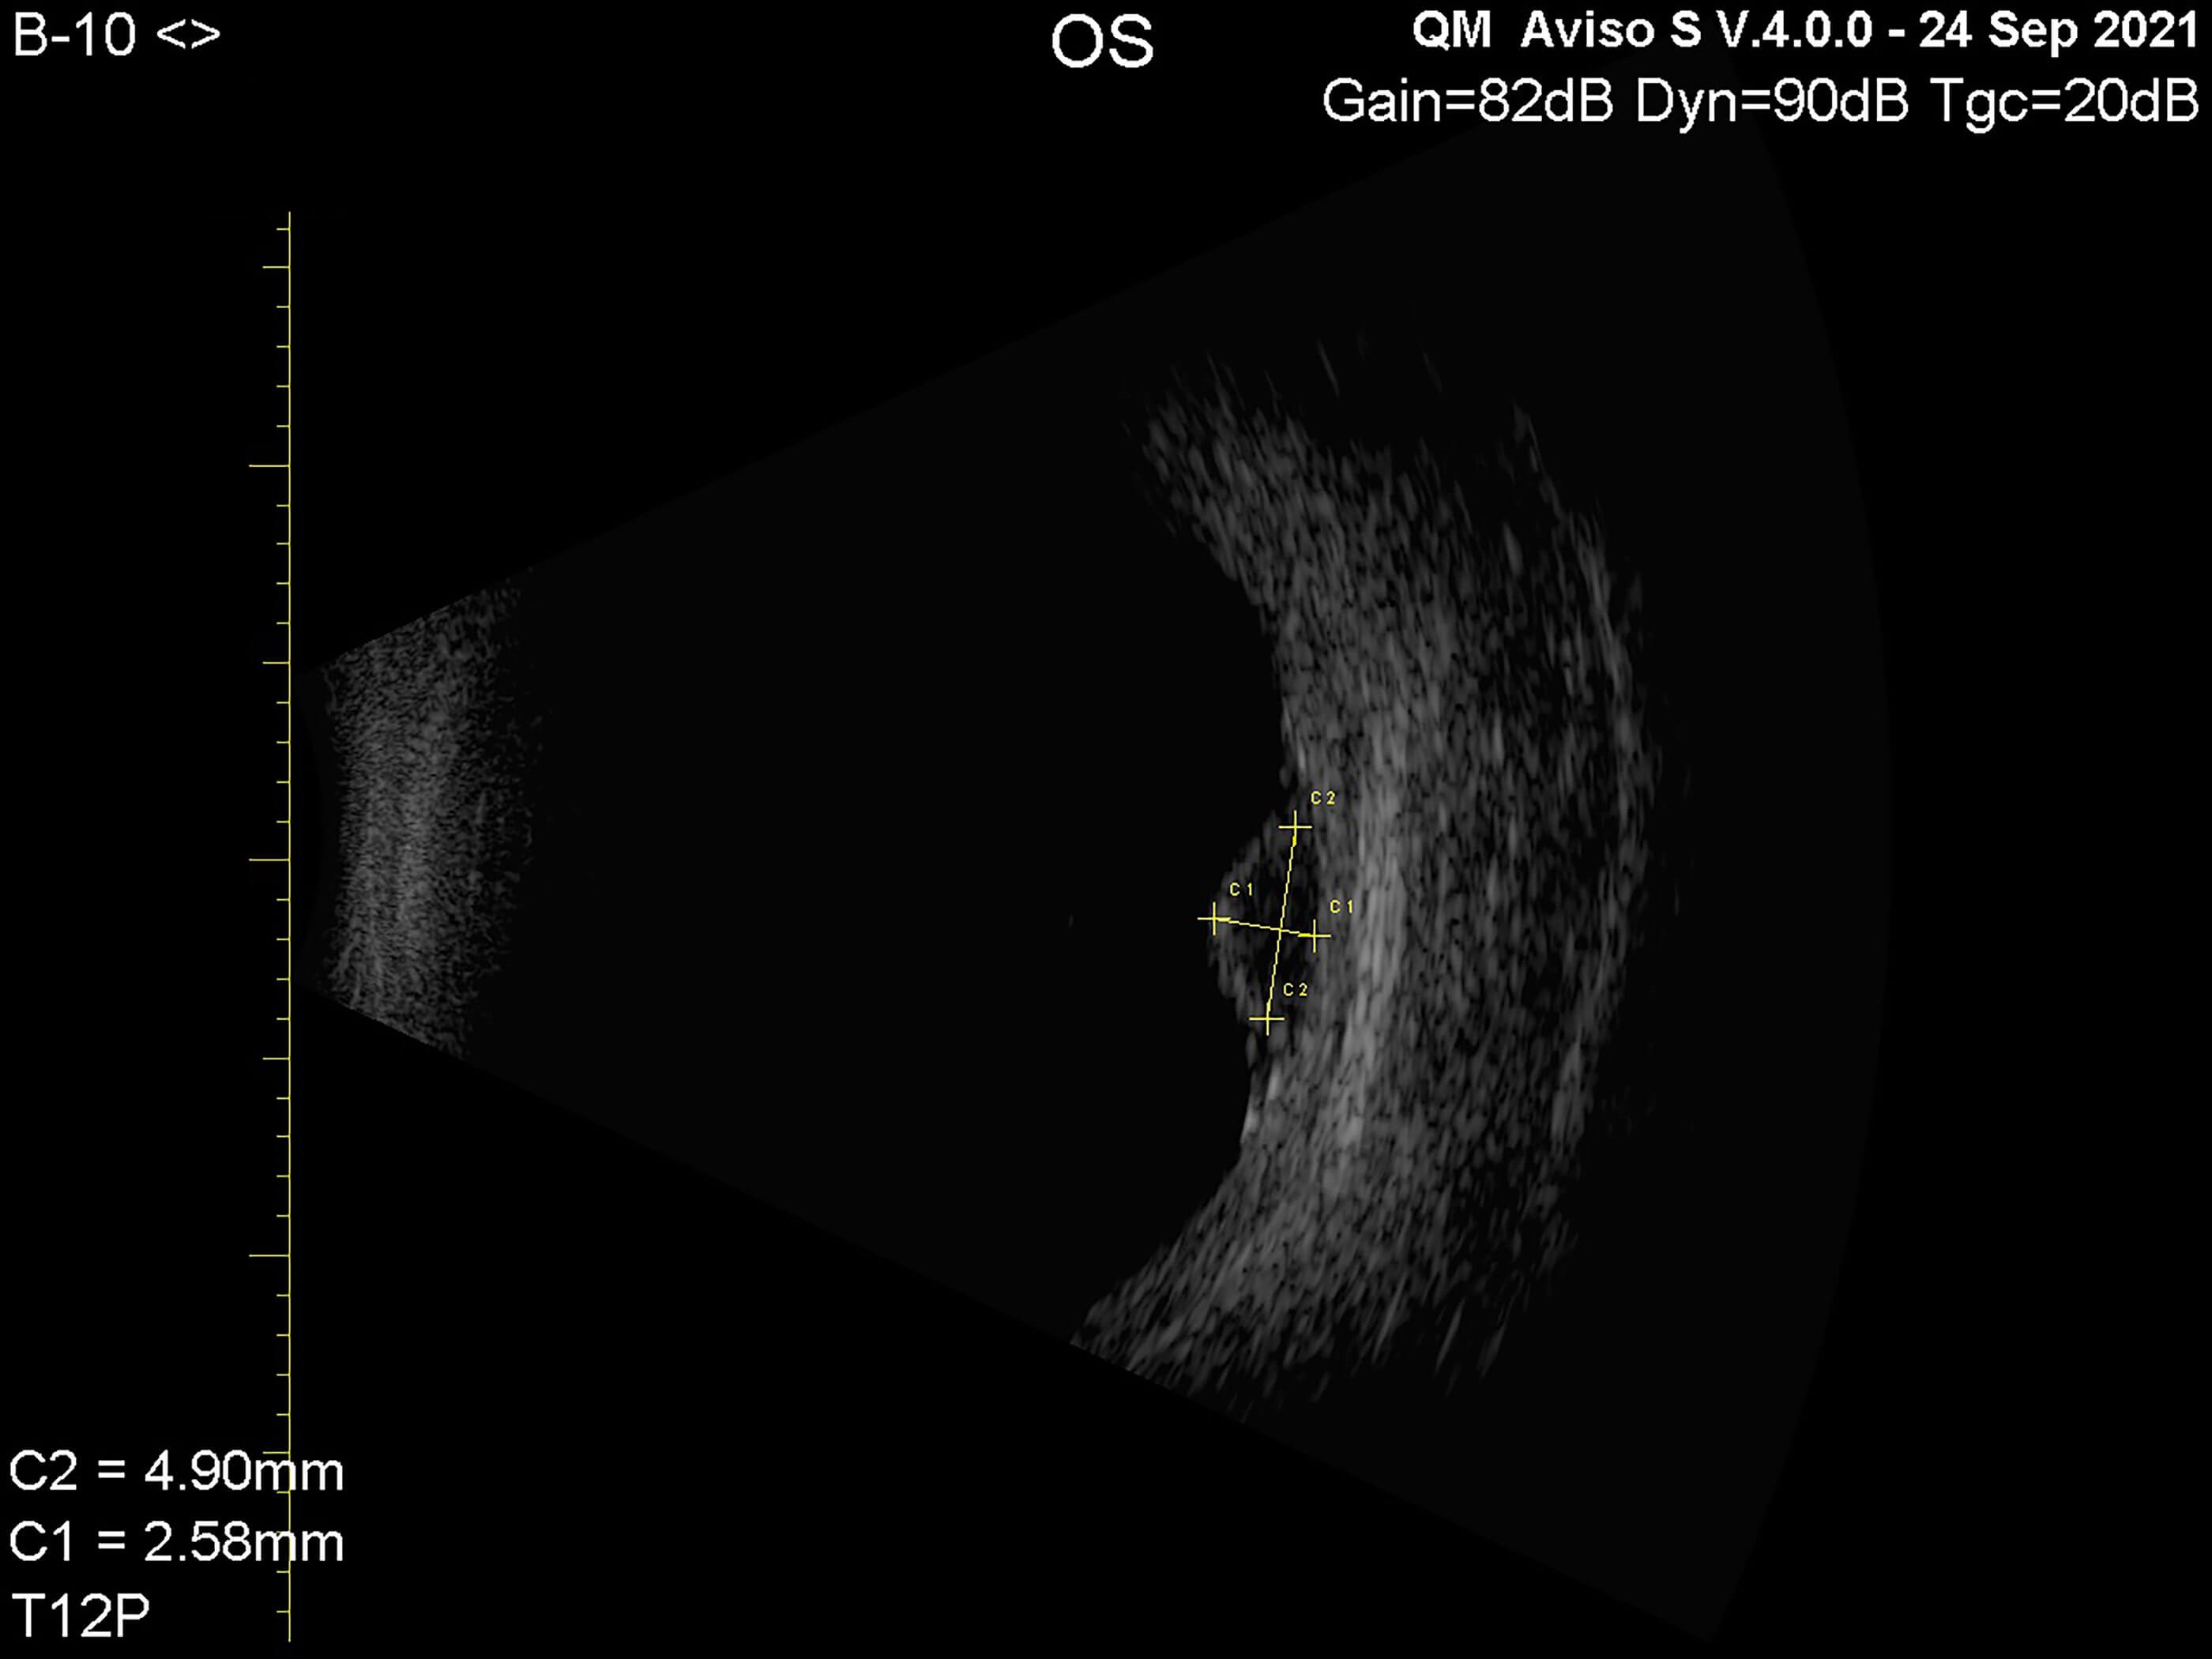
Figure 9.
The patient returned in 2021 following time away and the naevus looked a little bigger on OCT imaging (Figure 8), so ultrasound was performed (Figure 9). There is a solitary, ovoid pigmentary choroidal lesion in the superior aspect of left fundus, not associated with any auto fluorescence. Upon ultrasound, the contour and elevation of the lesion had changed since 2019, displaying a max elevation of 2.58mm and reduced internal reflectivity.
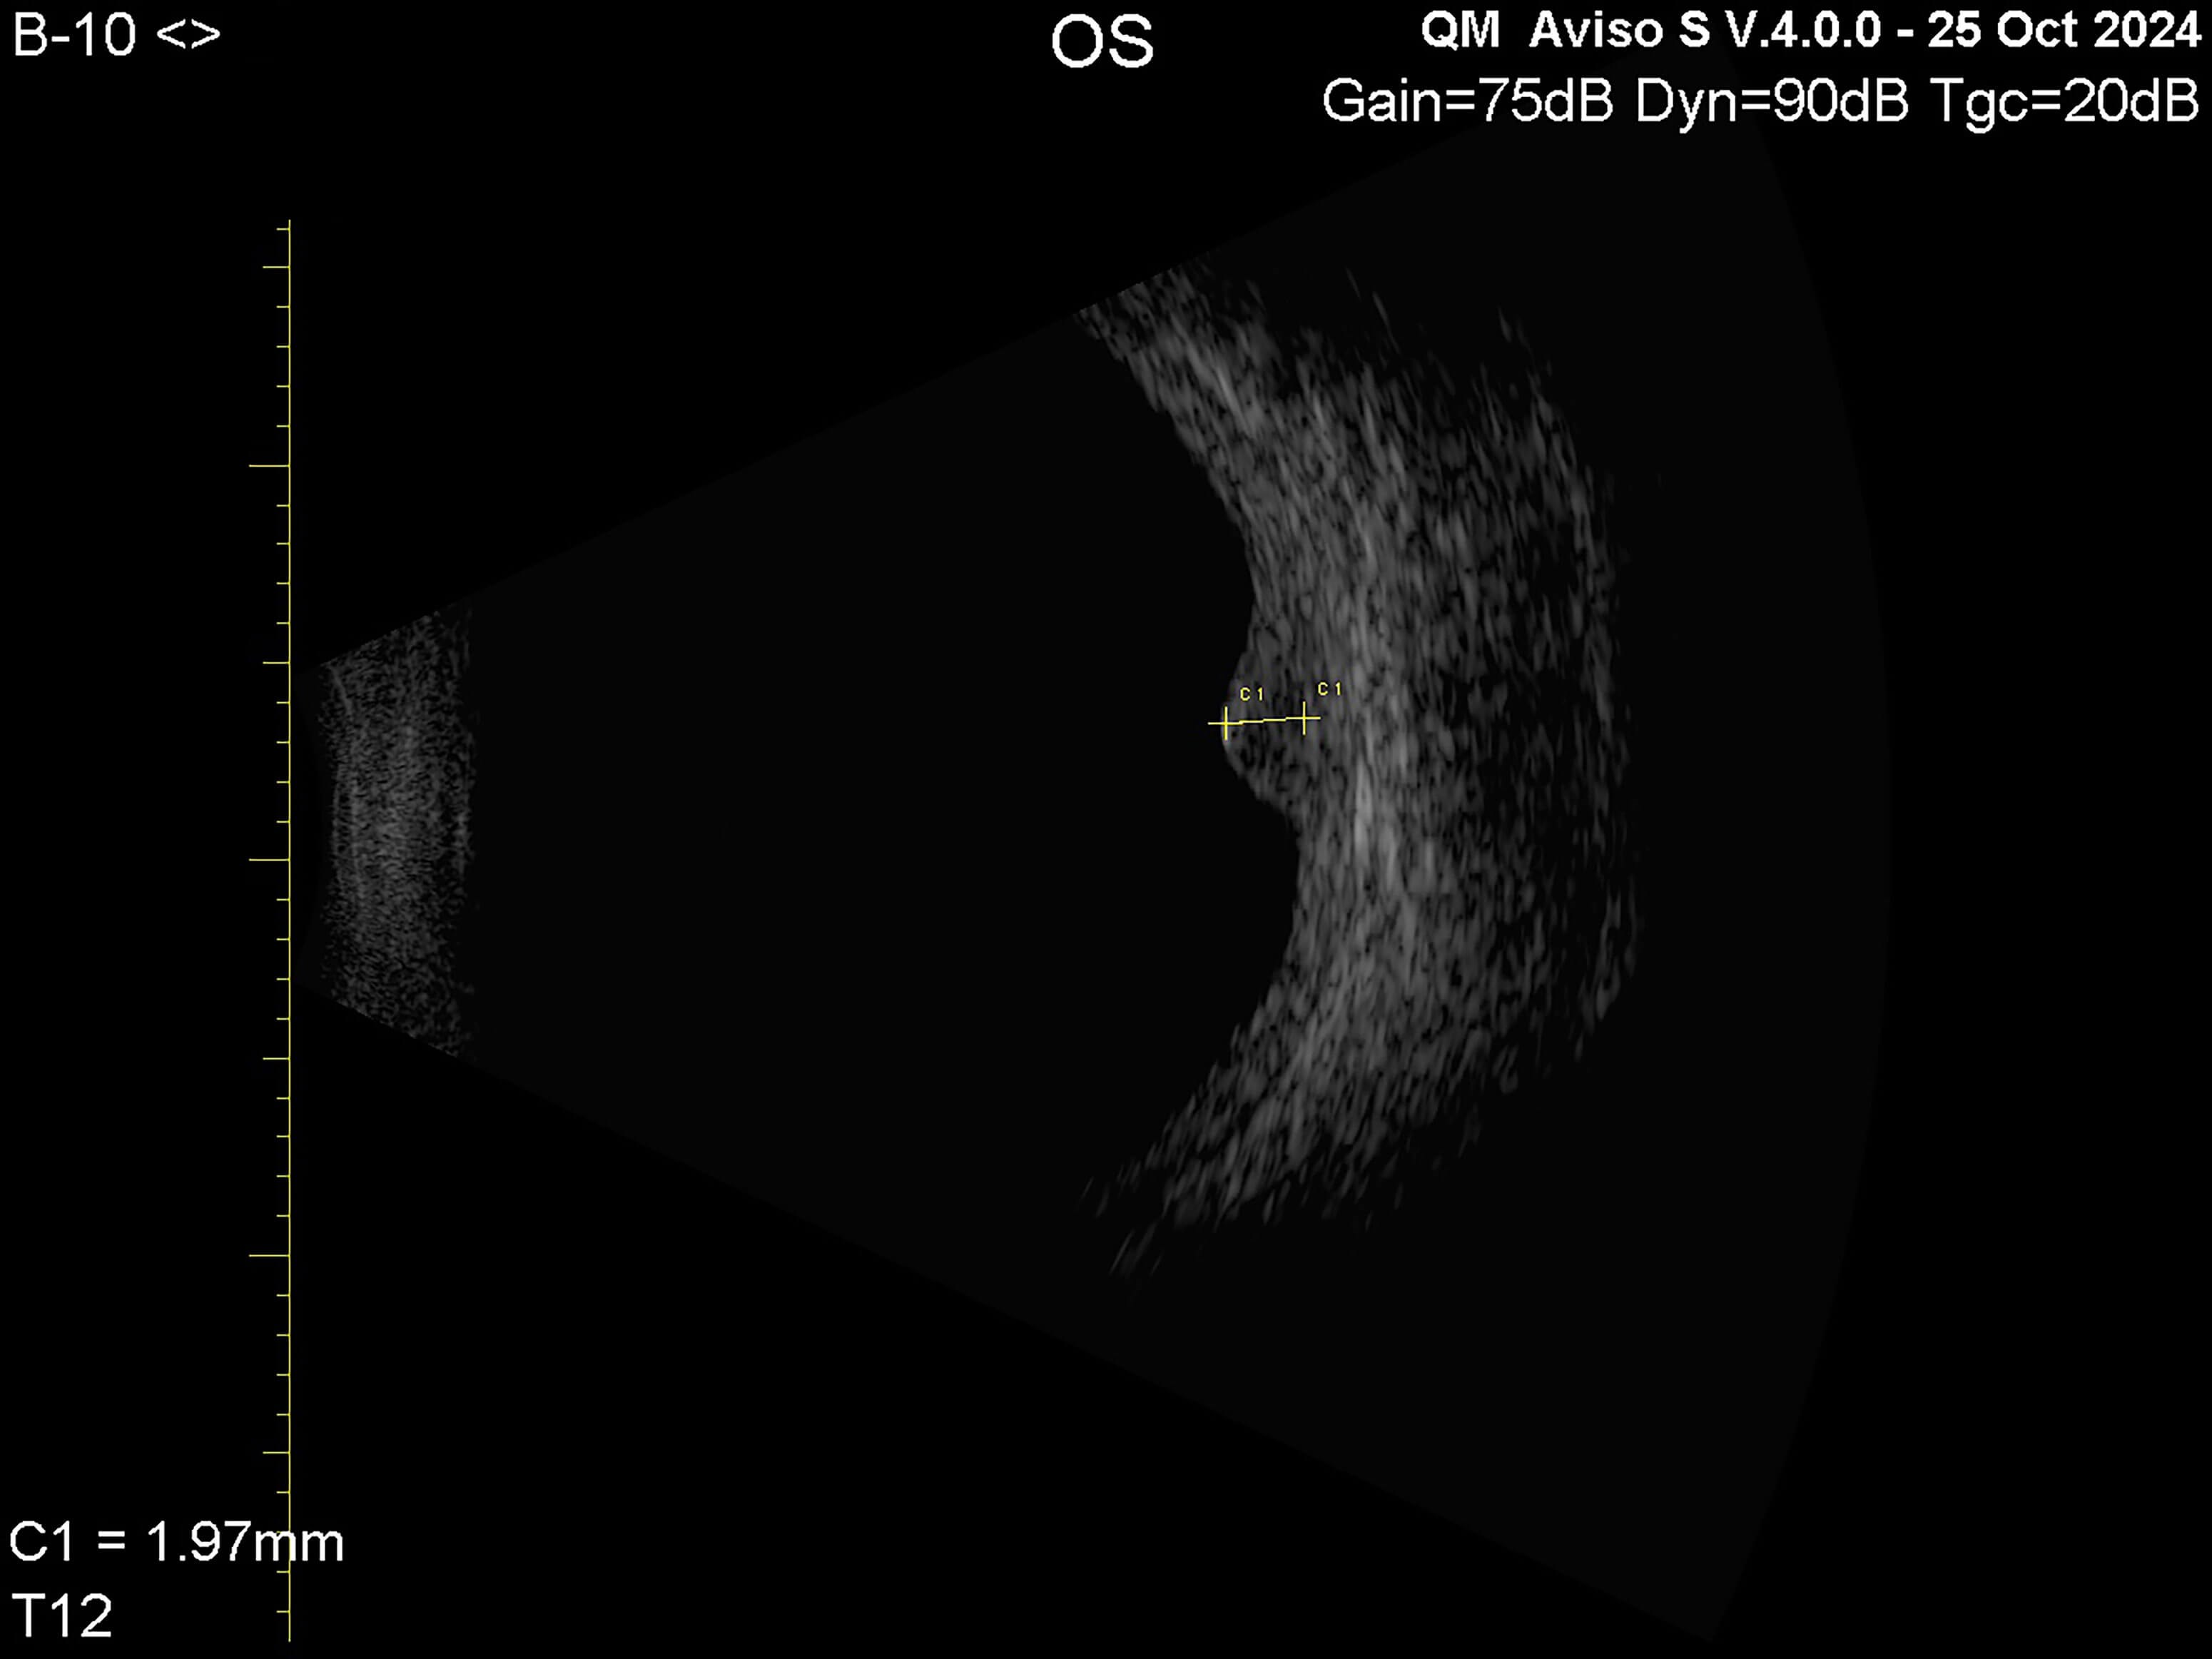
Figure 10.
The patient was sent to Sheffield for treatment as they confirmed it was a small melanoma. The melanoma was treated with ruthenium plaque brachytherapy in November 2021. After Covid-19, the patient returned in 2024. Fibrosis on surface lesion, smooth contour, high internal reflectivity, no surrounding fluid detected, 1.7 x 1.9mm (Figure 10).
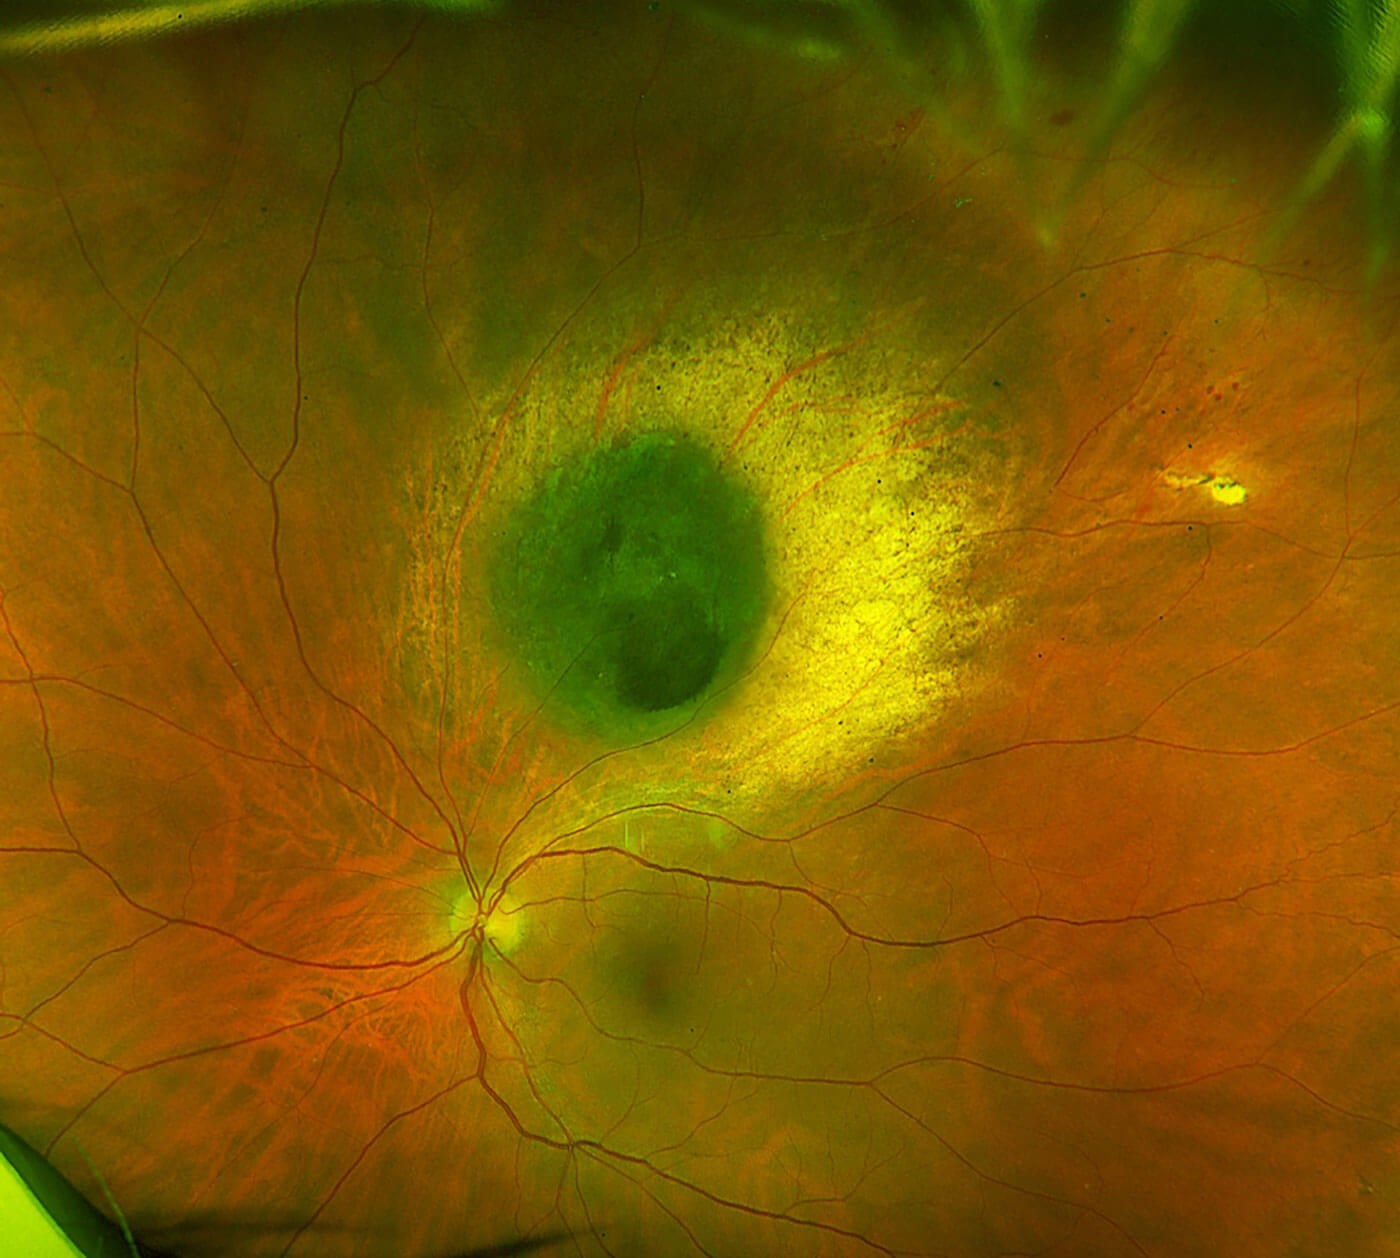
Figure 11.
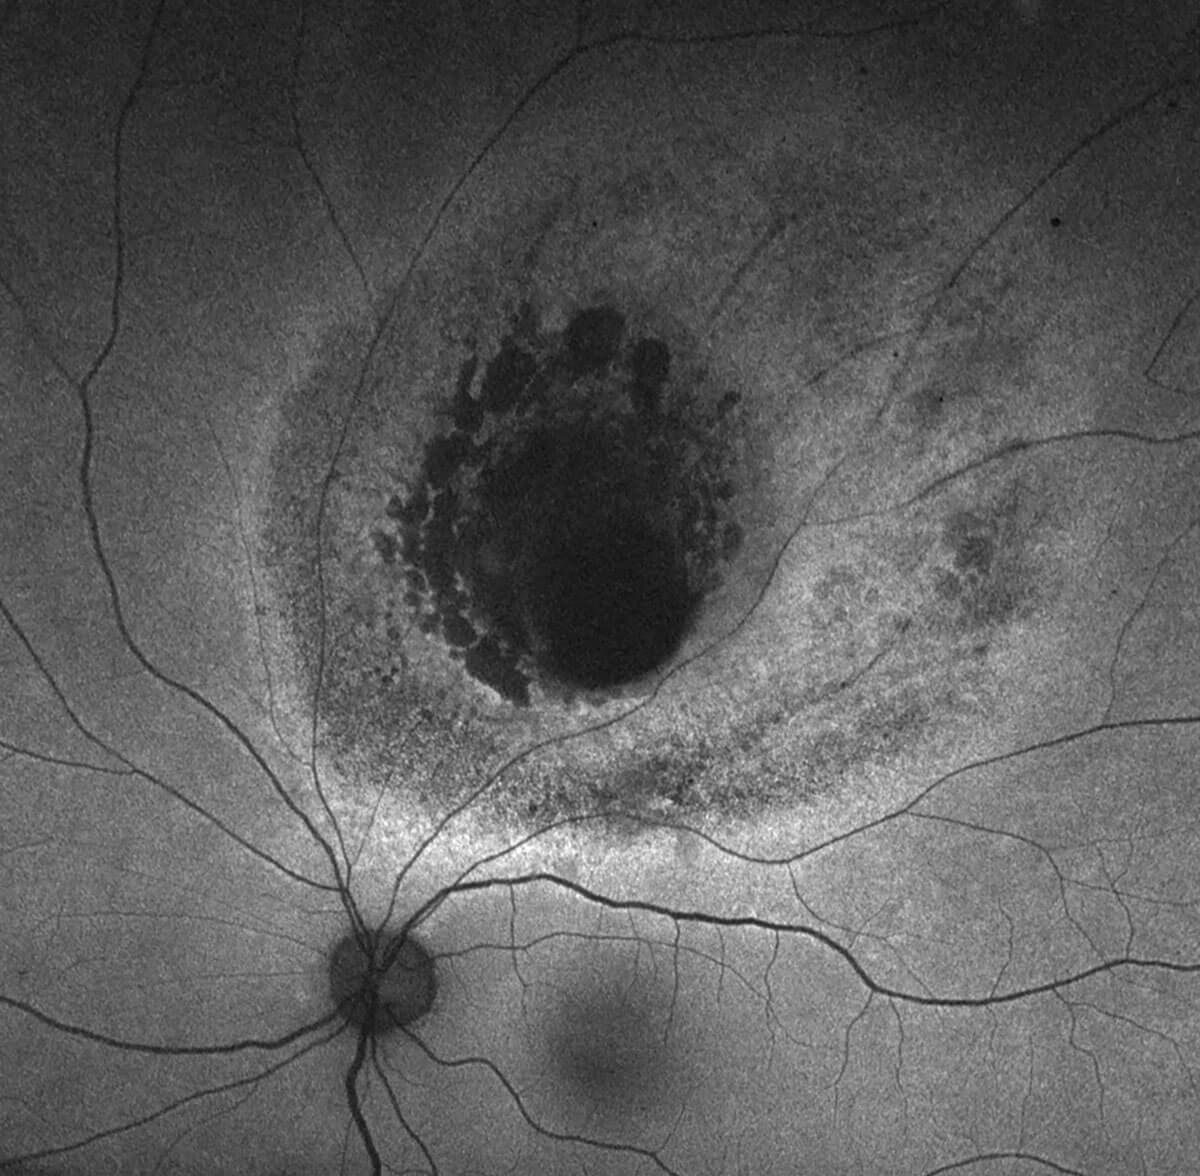
Figure 12.
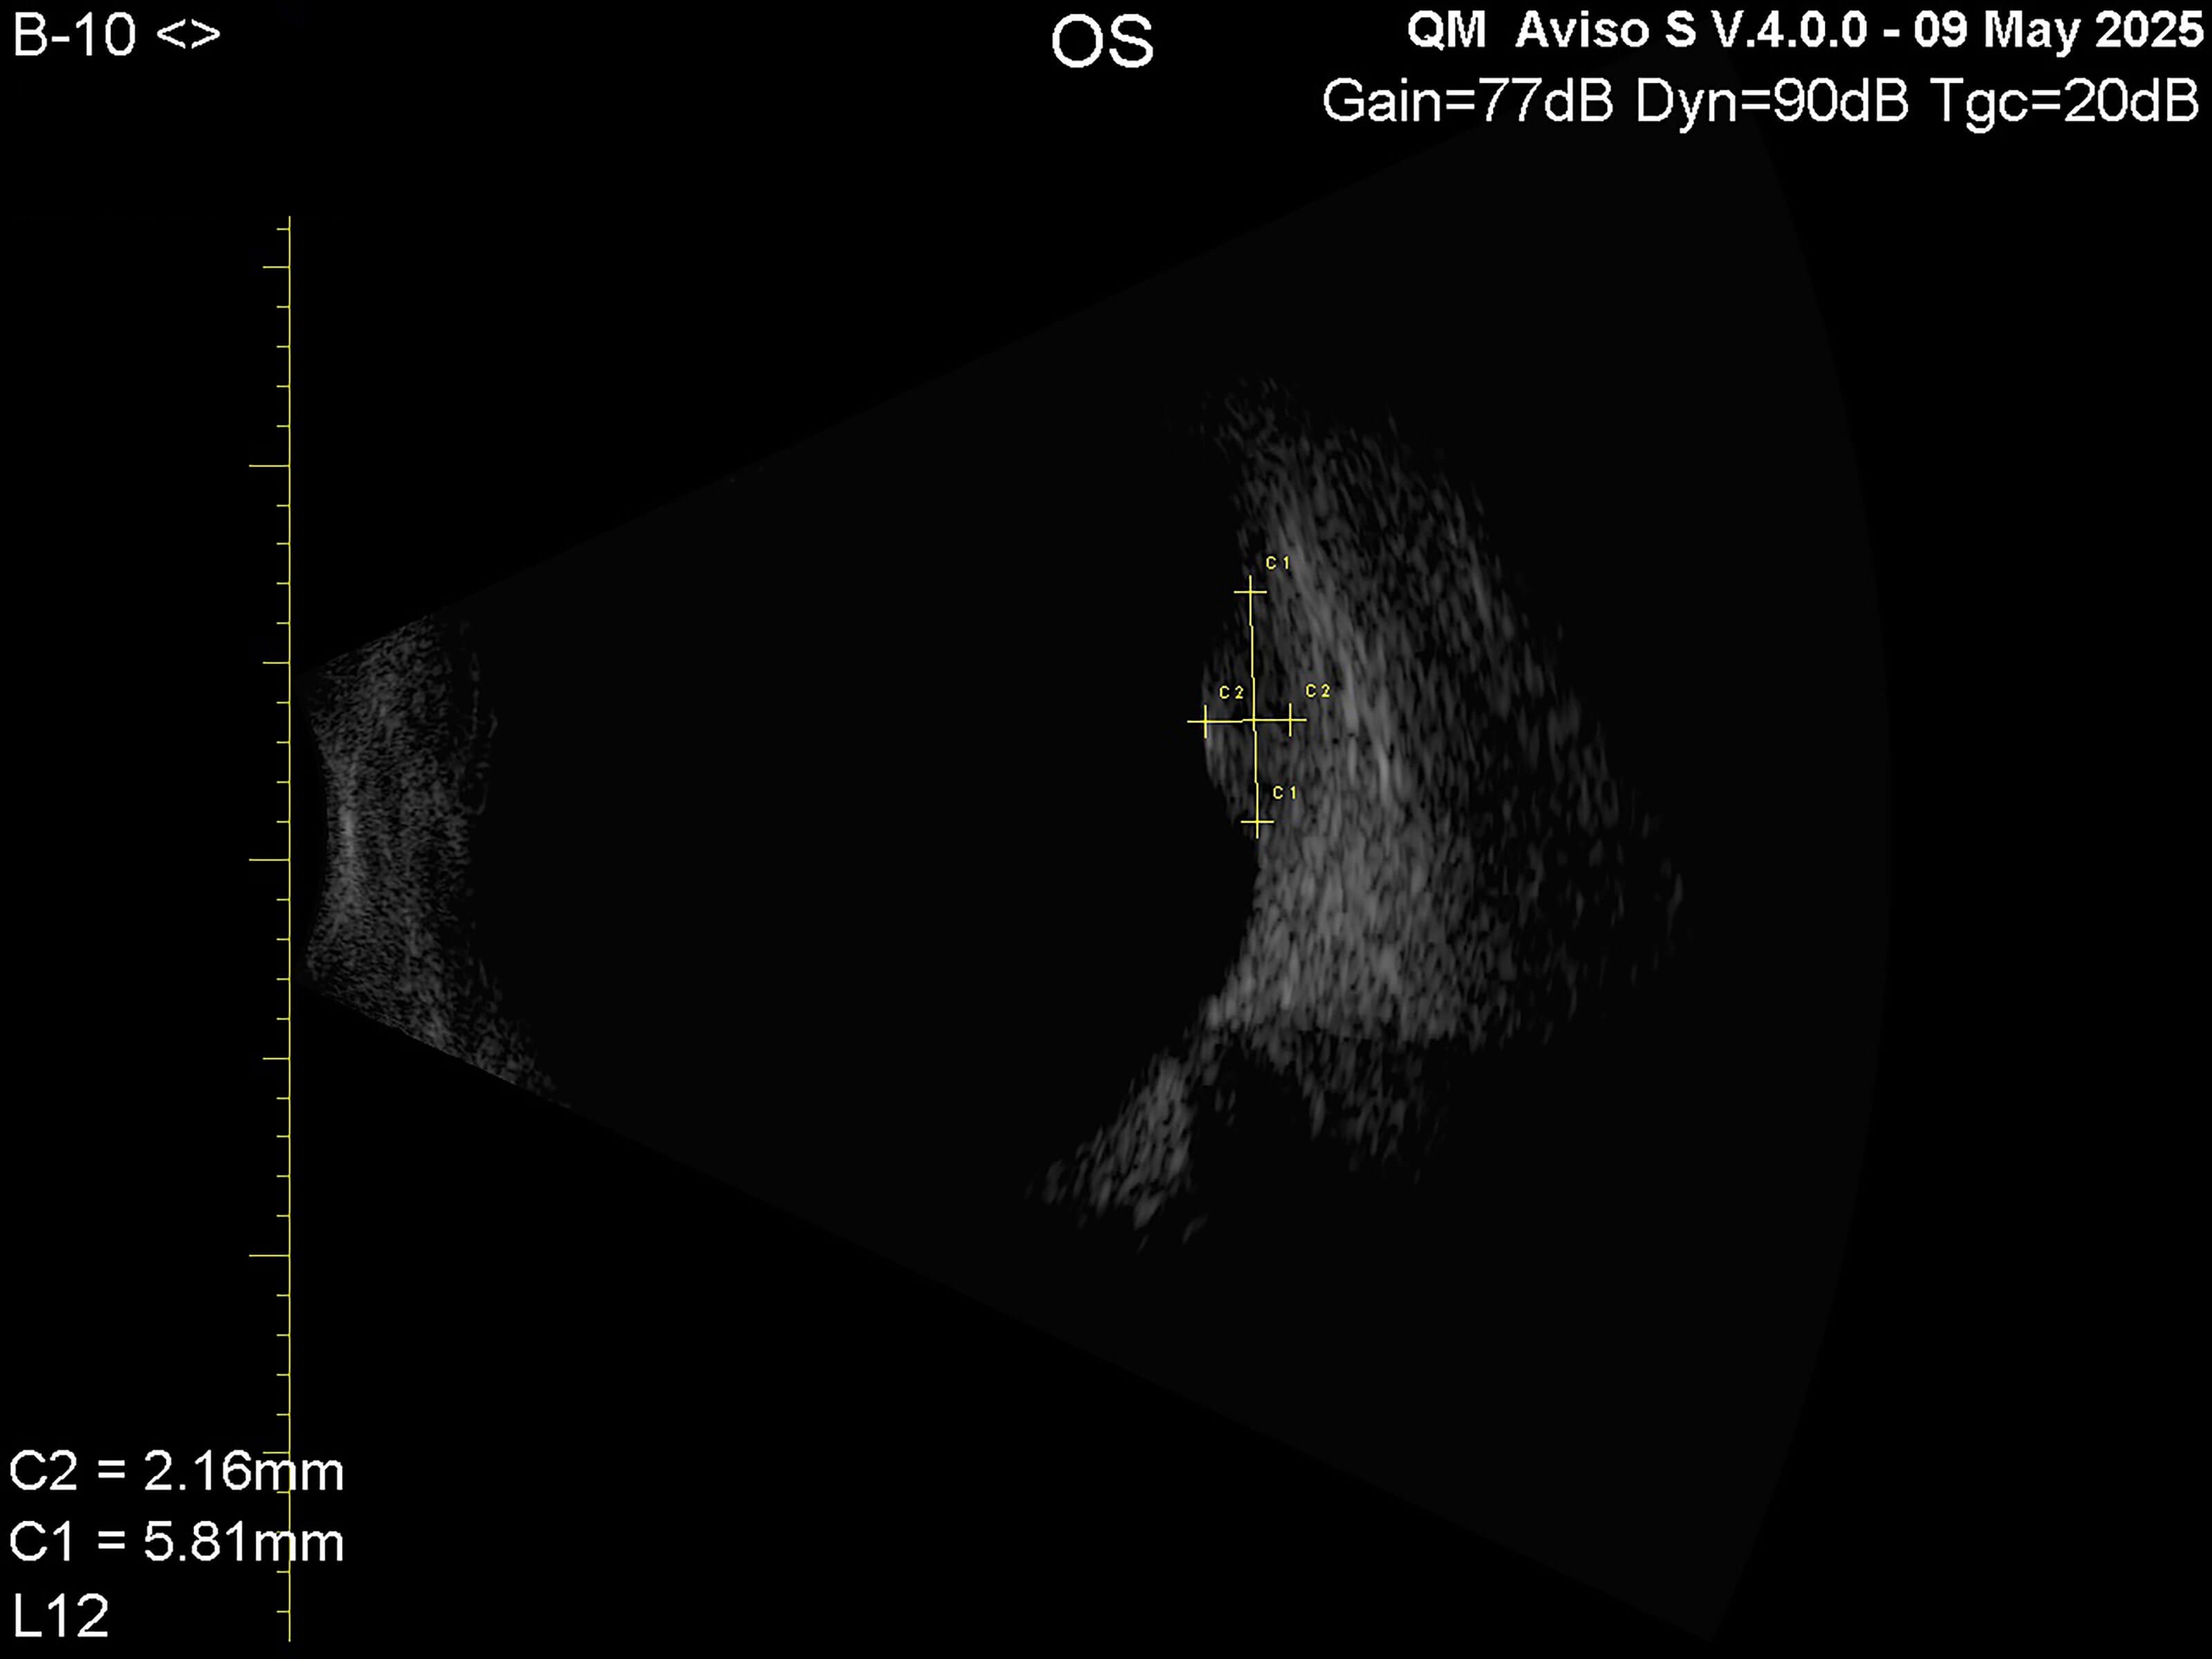
Figure 13.
The patient then returned in 2025 for a routine check-up in the ultrasound clinic. Further images were taken including colour (Figure 11) and fundus auto fluorescence (Figure 12). Ultrasound was performed (Figure 13) and happy to report no further intervention is required.
The figures in this case study have demonstrated that ultrasound has played an important role in being able to measure lesions. Without this technology, it would be probable to say that melanomas may not be easily identified.
Conclusion
As you have read, ultrasonography proves extremely useful in terms of sizing, diagnosing and evaluating different pathologies within the eye. I do not know what the future holds in terms of advancing the equipment but if you get the chance to perform and ‘have a go’, my advice is please do.
References
1. Chaudhari HD, Thakkar GN, Gandhi VS, et al. Role of Ultrasonography in evaluation of orbital lesions. Gujarat Med J 2013;68(2).
2. Harrie RP. The ongoing role of ophthalmic ultrasound. Review Ophthalmol 2011:
https://www.reviewofophthalmology.com/
article/the-ongoing-role-of-ophthalmic-ultrasound
3. Waldron RG. A-Scan Biometry. Medscape 2022:
http://emedicine.medscape.com/
article/1228447-overview
4. Chopdar A, Aung T. Multimodal retinal imaging. JP Medical Ltd;2014.
5. Green M, Hussain A, Ness S. Using Ultrasound in Intraocular Diagnosis Part 1: Image Acquisition. Ophthalmic Pearls 2024:
https://www.aao.org/eyenet/article/using
-ultrasound-in-intraocular-diagnosis-part-1
6. Silverman RH. Focused ultrasound in ophthalmology. Clin Ophthalmol 2016;10:1865–75.
7. Kendall CJ, Prager TC, Cheng H, et al. Diagnostic Ophthalmic Ultrasound for Radiologists. Neuroimaging Clin N Am 2015;25(3):327–65.
Declaration of competing interests: None declared.